
44B Mitchell DriveWest Hoxton NSW 2171
Property Details for 44b Mitchell Dr, West Hoxton
44b Mitchell Dr, West Hoxton is a 4 bedroom, 2 bathroom House with 2 parking spaces and was built in 2006. The property has a land size of 300m2 and floor size of 169m2. While the property is not currently for sale or for rent, it was last sold in April 2014.
Last Listing description (April 2014)
Sensationally renovated family home with fabulous living areas.
4 large bedrooms with built ins
Open plan living
Formal dining
Double lock up drive through garage
Covered outdoor entertaining area
Ducted air conditioning, ducted vacuum and alarm
Amazing kitchen with state of the art appliances.
Nothing to do!!
This will sell quickly and is a must to inspect
Property History for 44b Mitchell Dr, West Hoxton, NSW 2171
- 09 Apr 2014Sold for $580,000
- 25 Feb 2014Listed for Sale $599,000
- 18 Oct 2011Sold for $460,000

Recent sales nearby
See more recent sales nearbySimilar properties For Sale nearby
See more properties for sale nearby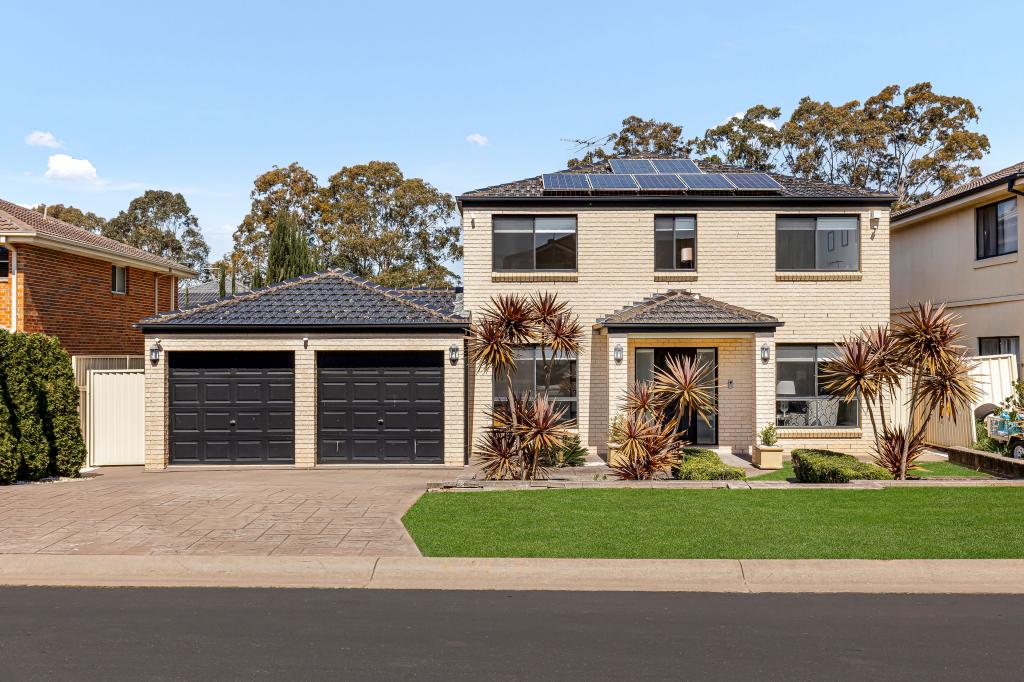 0
0 0
0 0
0Similar properties For Rent nearby
See more properties for rent nearby 0
0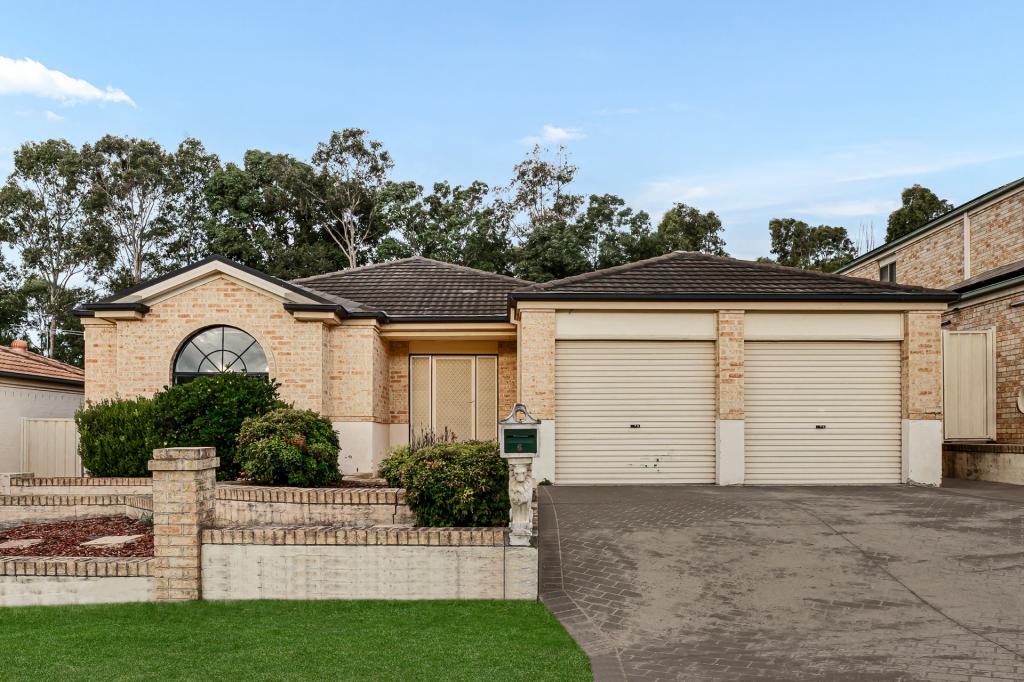 0
0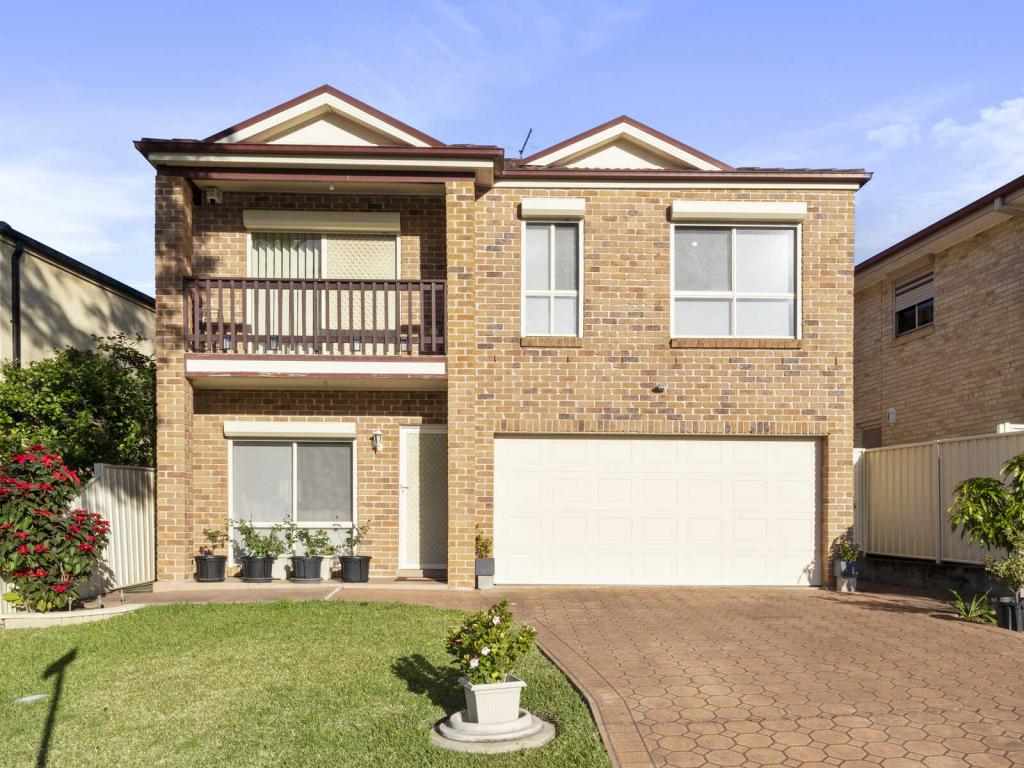 0
0About West Hoxton 2171
The size of West Hoxton is approximately 6.3 square kilometres. There are 15 parks, covering nearly 65.6% of the total area. The population of West Hoxton in 2016 was 10012 people. By 2021 the population was 10152 showing a population growth of 1.4% in the area during that time. The predominant age group in West Hoxton is 10-19 years. Households in West Hoxton are primarily couples with children and are likely to be repaying $1800 - $2399 per month on mortgage repayments. In general, people in West Hoxton work in a professional occupation.In 2021, 80.70% of the homes in West Hoxton were owner-occupied compared with 81.70% in 2016.
West Hoxton has 2,955 properties. Over the last 5 years, Houses in West Hoxton have seen a 47.42% increase in median value, while Units have seen a 33.98% increase. As at 31 May 2026:
- The median value for Houses in West Hoxton is $1,375,915 while the median value for Units is $920,018.
- Houses have a median rent of $800 while Units have a median rent of $550.
Suburb Insights for West Hoxton 2171
Market Insights
West Hoxton Trends for Houses
N/A
N/A
View TrendN/A
N/A
West Hoxton Trends for Units
N/A
N/A
View TrendN/A
N/A
Neighbourhood Insights
© Copyright 2026. RP Data Pty Ltd trading as Cotality (Cotality). All rights reserved. No reproduction, distribution, or transmission of the copyrighted materials is permitted. The information is deemed reliable but not guaranteed.
While Cotality uses commercially reasonable efforts to ensure the Cotality Data is current, Cotality does not warrant the accuracy, currency or completeness of the Cotality Data and to the full extent permitted by law excludes all loss or damage howsoever arising (including through negligence) in connection with the Cotality Data.
This product uses cookies and other similar technologies to improve and customise your browsing experience, to tailor content and adverts, and for analytics and metrics regarding visitor usage on this product and other media. We may share cookie and analytics information with third parties for the purposes of advertising. By continuing to use our website, you consent to cookies being used. View our Privacy Policy here.
X