
65 Murray StreetTumbarumba NSW 2653
Property Details for 65 Murray St, Tumbarumba
65 Murray St, Tumbarumba is a 3 bedroom, 1 bathroom House with 2 parking spaces and was built in 1950. The property has a land size of 482m2 and floor size of 150m2. While the property is not currently for sale or for rent, it was last sold in May 2022.
Last Listing description (May 2022)
Location is key here with only a short walk to the main street, schools, doctors and cafe's this property will be hard to look past.
Stunning ornate ceilings
Renovated kitchen
New carpet throughout
Wood heating + reverse cycle wall mounted unit
3.5kw solar system
Large outdoor living area undercover
Low maintenance
481m2 block
Property History for 65 Murray St, Tumbarumba, NSW 2653
- 18 May 2022Listed for Sale SOLD - $290,000
- 17 May 2022Sold for $290,000
- 08 Mar 2012Sold for $186,000

Recent sales nearby
See more recent sales nearby

Similar properties For Sale nearby
See more properties for sale nearby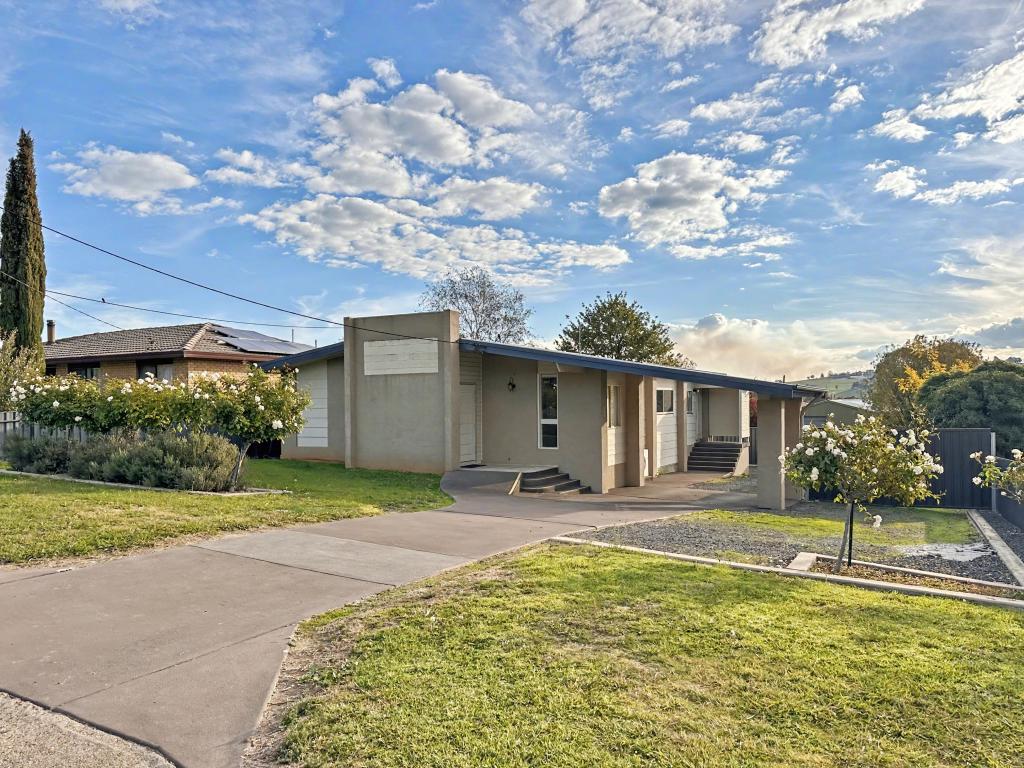 0
0 0
0 0
0Similar properties For Rent nearby
See more properties for rent nearby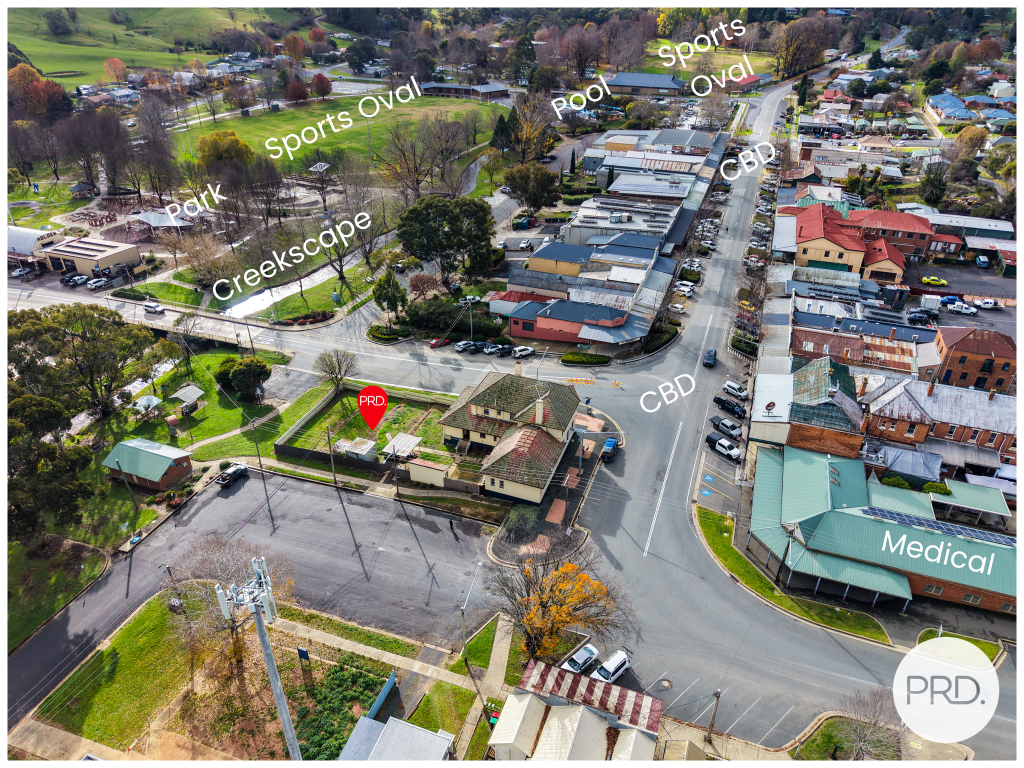 0
0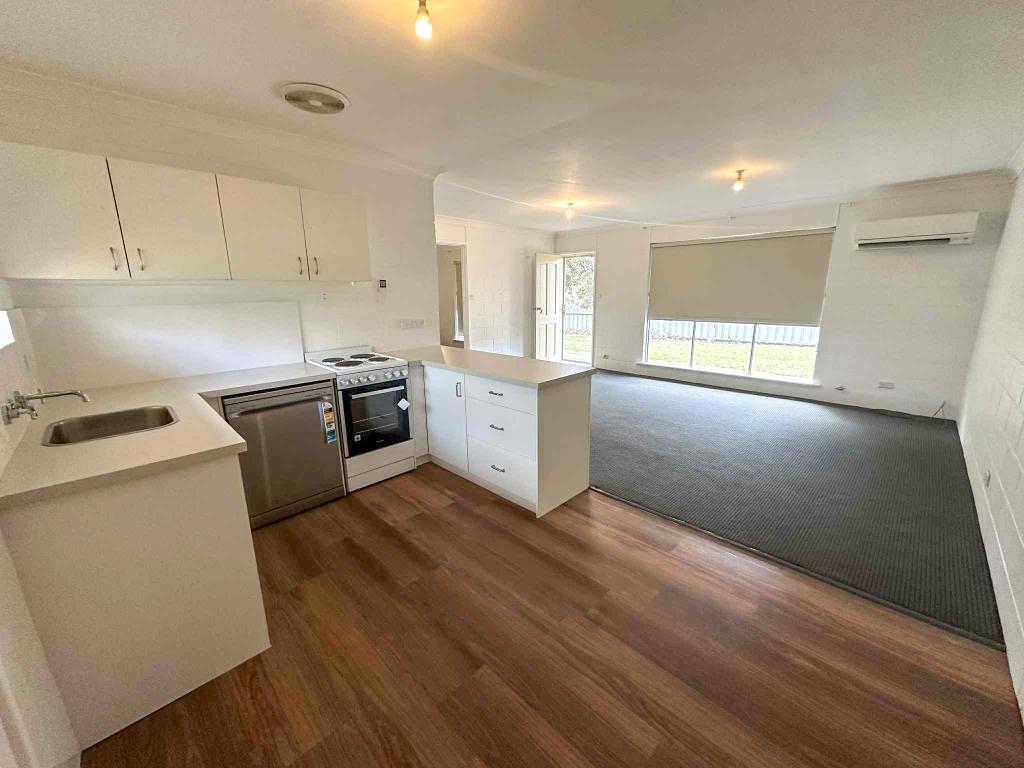 0
0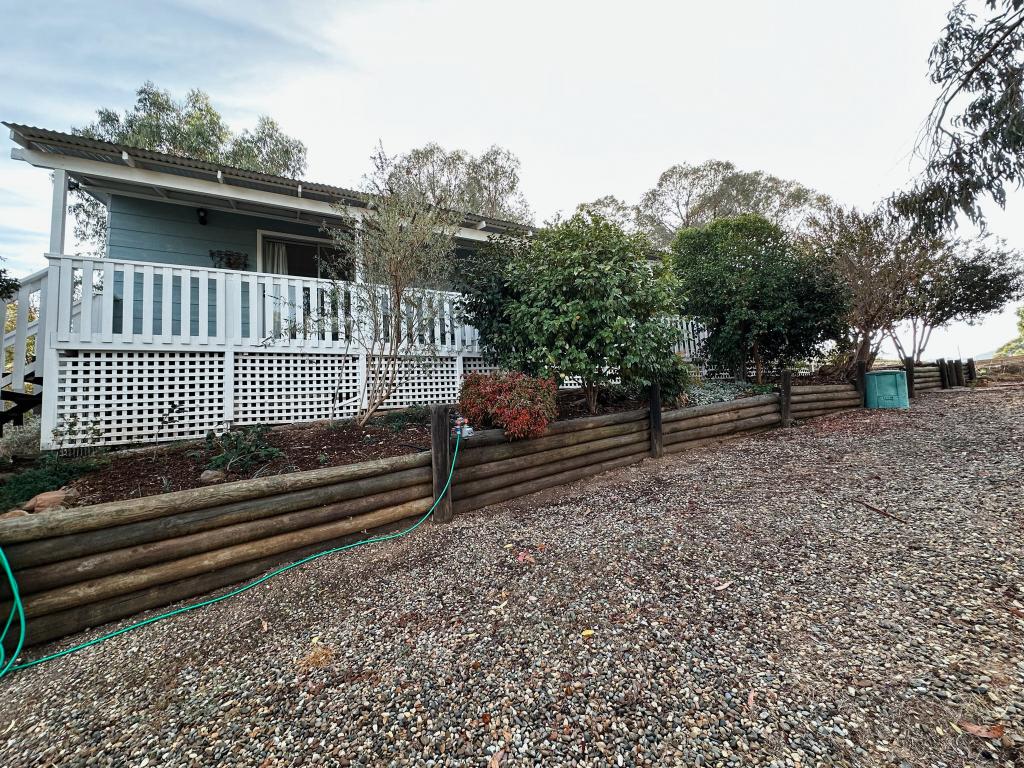 0
0About Tumbarumba 2653
The size of Tumbarumba is approximately 231.7 square kilometres. There are 6 parks, covering nearly 48.4% of the total area. The population of Tumbarumba in 2016 was 1862 people. By 2021 the population was 1915 showing a population growth of 2.8% in the area during that time. The predominant age group in Tumbarumba is 60-69 years. Households in Tumbarumba are primarily childless couples and are likely to be repaying $1000 - $1399 per month on mortgage repayments. In general, people in Tumbarumba work in a labourer occupation.In 2021, 70.80% of the homes in Tumbarumba were owner-occupied compared with 68.70% in 2016.
Tumbarumba has 1,339 properties. Over the last 5 years, Houses in Tumbarumba have seen a 44.76% increase in median value, while Units have seen a 97.27% increase. As at 30 June 2026:
- The median value for Houses in Tumbarumba is $400,159 while the median value for Units is $361,831.
- Houses have a median rent of $410 while Units have a median rent of $170.
Suburb Insights for Tumbarumba 2653
Market Insights
Tumbarumba Trends for Houses
N/A
N/A
View TrendN/A
N/A
Tumbarumba Trends for Units
N/A
N/A
View TrendN/A
N/A
Neighbourhood Insights
© Copyright 2026. RP Data Pty Ltd trading as Cotality (Cotality). All rights reserved. No reproduction, distribution, or transmission of the copyrighted materials is permitted. The information is deemed reliable but not guaranteed.
While Cotality uses commercially reasonable efforts to ensure the Cotality Data is current, Cotality does not warrant the accuracy, currency or completeness of the Cotality Data and to the full extent permitted by law excludes all loss or damage howsoever arising (including through negligence) in connection with the Cotality Data.
This product uses cookies and other similar technologies to improve and customise your browsing experience, to tailor content and adverts, and for analytics and metrics regarding visitor usage on this product and other media. We may share cookie and analytics information with third parties for the purposes of advertising. By continuing to use our website, you consent to cookies being used. View our Privacy Policy here.
X