
21 Nordlingen DriveTolland NSW 2650
Property Details for 21 Nordlingen Dr, Tolland
21 Nordlingen Dr, Tolland is a 2 bedroom, 1 bathroom Unit with 1 parking spaces and was built in 1980. The property has a land size of 898m2 and floor size of 67m2. While the property is not currently for sale or for rent, it was last sold in September 2001.
Last Listing description (March 2020)
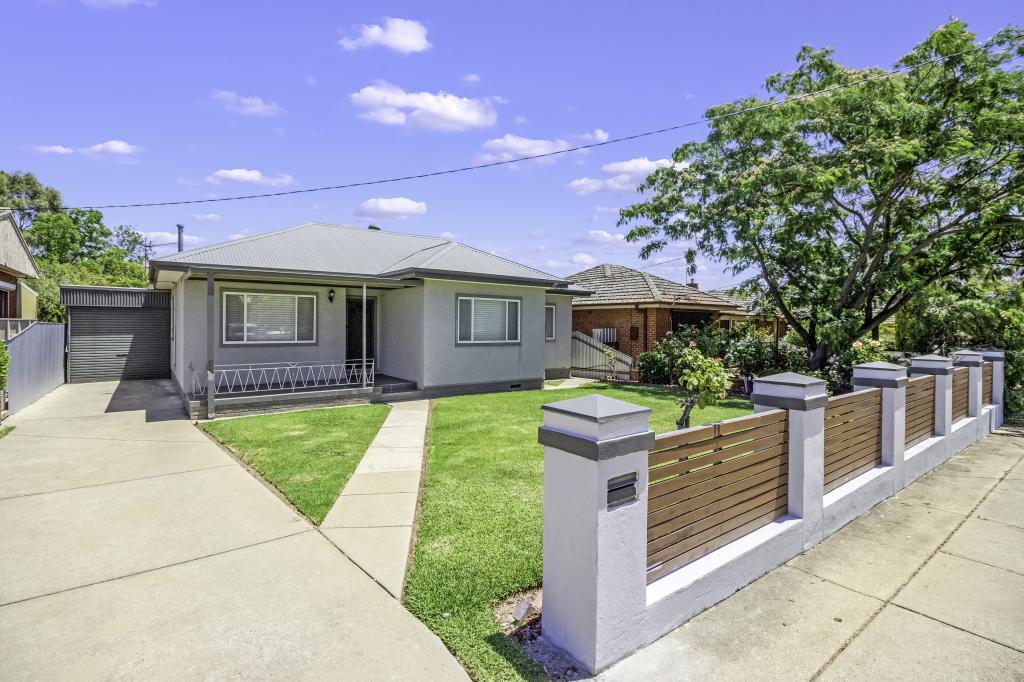
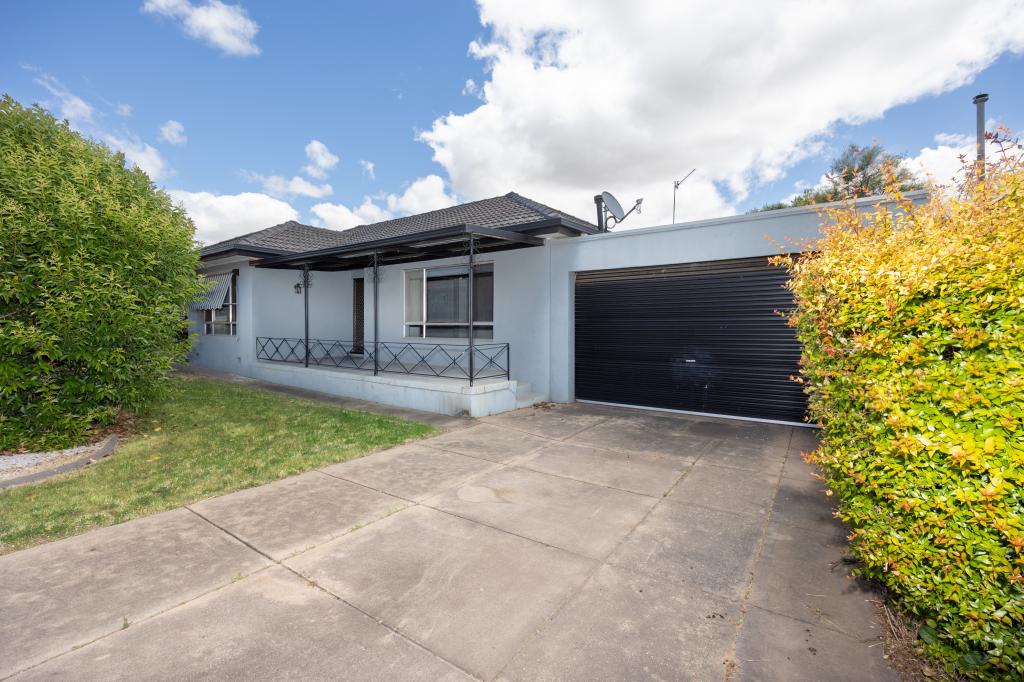
This neat and tidy two bedroom unit features zero maintenance, close to shops, schools and parks. Book your inspection now so you don't miss out!
-Large open plan lounge and dining room
-Reverse cycle air conditioning and gas heating
-Built in robes in both bedrooms
-Combined bathroom/laundry
-Carport
-Close to shops, parks & public transport
Property History for 21 Nordlingen Dr, Tolland, NSW 2650
- 03 Dec 2019Listed for Rent $175 / week
- 03 Apr 2018Listed for Rent $170 / week
- 30 Sep 2011Listed for Rent - Price not available

Recent sales nearby
See more recent sales nearbySimilar properties For Sale nearby
See more properties for sale nearby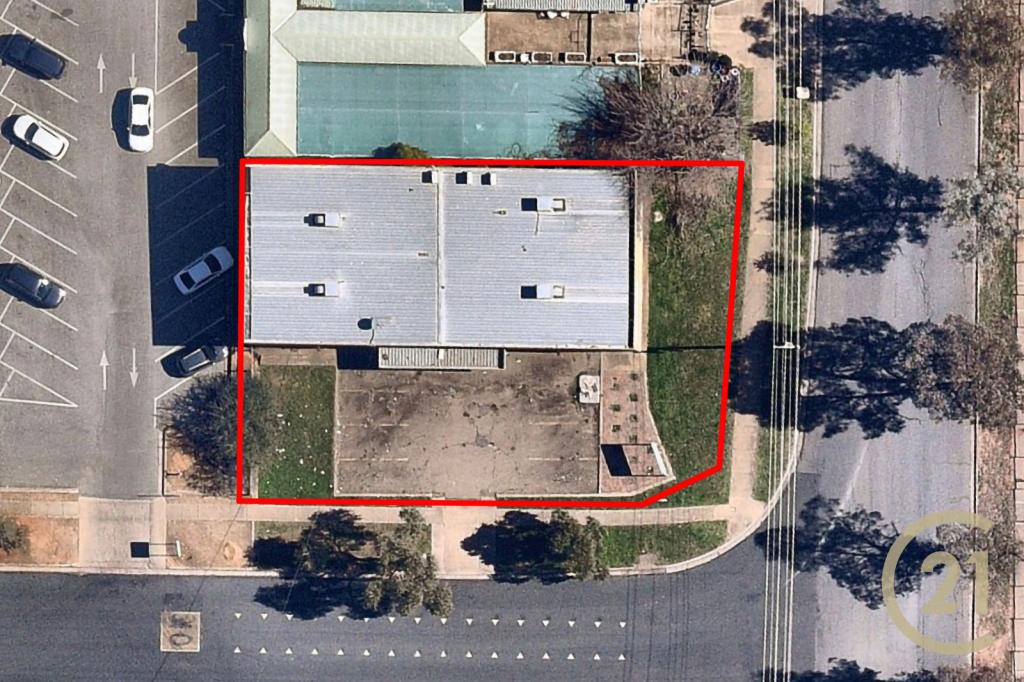 0
0
 0
0
 0
0Similar properties For Rent nearby
See more properties for rent nearby
 0
0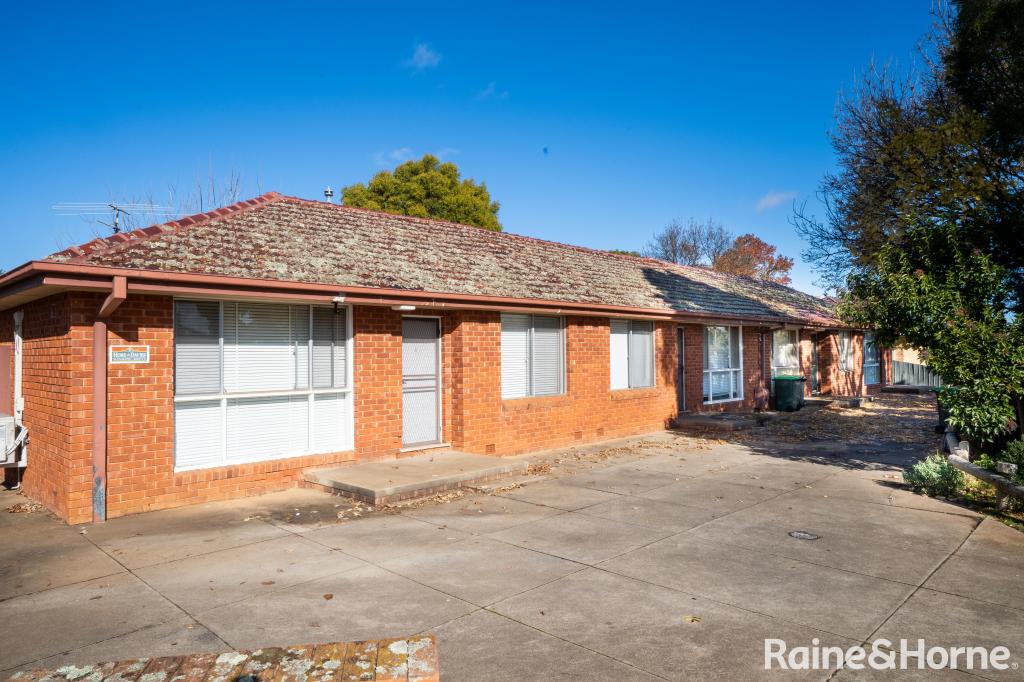 0
0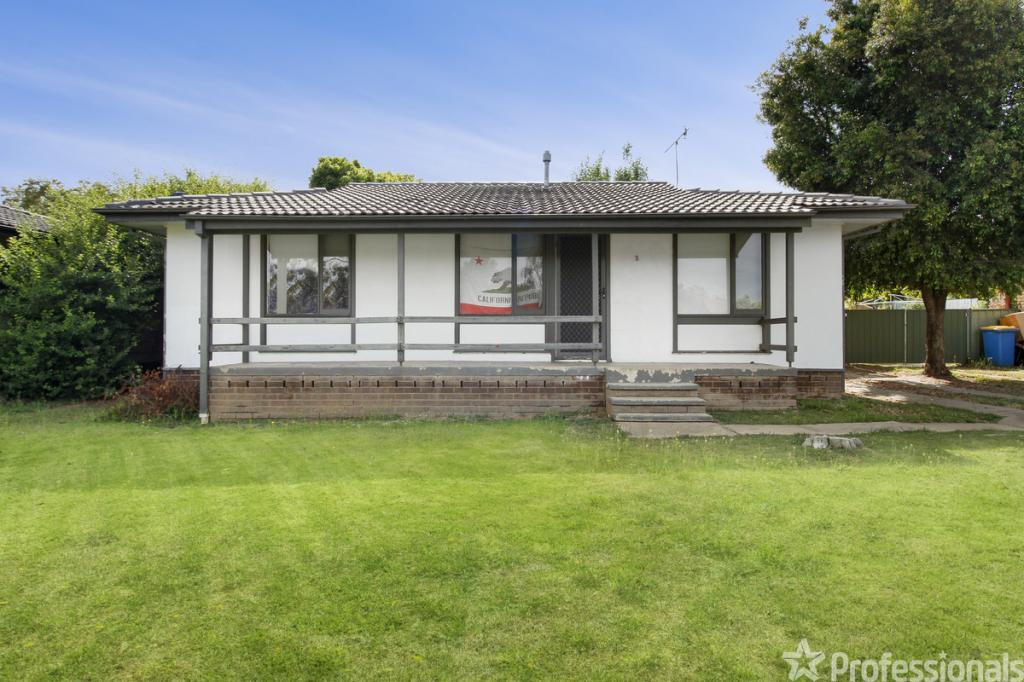 0
0About Tolland 2650
The size of Tolland is approximately 2.0 square kilometres. It has 4 parks covering nearly 11.9% of total area. The population of Tolland in 2016 was 3357 people. By 2021 the population was 3459 showing a population growth of 3.0% in the area during that time. The predominant age group in Tolland is 0-9 years. Households in Tolland are primarily childless couples and are likely to be repaying $1000 - $1399 per month on mortgage repayments. In general, people in Tolland work in a labourer occupation.In 2021, 54.20% of the homes in Tolland were owner-occupied compared with 51.60% in 2016.
Tolland has 1,693 properties. Over the last 5 years, Houses in Tolland have seen a 106.57% increase in median value, while Units have seen a 93.87% increase. As at 30 November 2025:
- The median value for Houses in Tolland is $552,451 while the median value for Units is $389,412.
- Houses have a median rent of $460 while Units have a median rent of $330.
Suburb Insights for Tolland 2650
Market Insights
Tolland Trends for Houses
N/A
N/A
View TrendN/A
N/A
Tolland Trends for Units
N/A
N/A
View TrendN/A
N/A
Neighbourhood Insights
© Copyright 2025. RP Data Pty Ltd trading as Cotality (Cotality). All rights reserved. No reproduction, distribution, or transmission of the copyrighted materials is permitted. The information is deemed reliable but not guaranteed.
While Cotality uses commercially reasonable efforts to ensure the Cotality Data is current, Cotality does not warrant the accuracy, currency or completeness of the Cotality Data and to the full extent permitted by law excludes all loss or damage howsoever arising (including through negligence) in connection with the Cotality Data.
This product uses cookies and other similar technologies to improve and customise your browsing experience, to tailor content and adverts, and for analytics and metrics regarding visitor usage on this product and other media. We may share cookie and analytics information with third parties for the purposes of advertising. By continuing to use our website, you consent to cookies being used. View our Privacy Policy here.
X