
1101/343-357 Pitt StreetSydney NSW 2000
Property Details for 1101/343-357 Pitt St, Sydney
1101/343-357 Pitt St, Sydney is a 1 bedroom, 1 bathroom Unit with 1 parking spaces and was built in 1997. The property has a land size of 1454m2 and floor size of 58m2. While the property is not currently for sale or for rent, it was last sold in July 2014.
Last Listing description (July 2014)
NORTH FACING HUGE ONE BEDROOM APARTMENT IN CBD
THE FIRST OPEN FOR INSPECTION SATURDAY 12TH OF JULY 1PM - 1:45PM GREAT OPPORTUNITY TO SECURE THIS IDEAL LIFESTYLE APARTMENT IN THE HEART OF SYDNEY CITY. THIS PROPERTY REPRESENTS A GREAT INVESTMENT OPPORTUNITY WITH STRONG RENTAL RETURNS, AS WELL AS BEING IDEAL FOR OWNER-OCCUPIERS WHO ARE SEEKING TO LIVE IN THE HEART OF THE SYDNEY CBD. POSITIONED ON LEVEL 11 WITH A NORTH ASPECT AND ABUNDANCE OF NATURAL LIGHT. VAST LIVING AND DINING WITH A FLOOR TO CEILING GLASS DOOR LEAD ONTO THE PRIVATE OUTDOOR BALCONY. QUEEN SIZED BEDROOM WITH BUILT-IN WARDROBES AND BALCONY ACCESS. STYLISH GOURMET KITCHEN WITH STONE BENCH TOPS AND STAINLESS STEEL APPLIANCES. A FULL SIZE BATHROOM WITH A SEPARATE SHOWER AND BATHTUB. AIR-CONDITIONING, INTERCOM SYSTEM AND INTERNAL LAUNDRY. EXCELLENT RESORT STYLE FACILITIES INCLUDE 25 METRE HEATED LAP POOL, SPA, SAUNA AND LARGE GYM. CONVENIENTLY LOCATED JUST MOMENTS TO GEORGE STREET, TOWN HALL STATION, PITT STREET SHOPPING MALL AND QUEEN VICTOR BUILDING. EXCELLENT TENANT $550 PER WEEK. OUTGOINGS: COUNCIL: $234 PER QUARTER WATER: $173.40 PER QUARTER STRATA: $673.48 PER QUARTER
Property History for 1101/343-357 Pitt St, Sydney, NSW 2000
- 12 Jul 2014Sold for $615,000
- 05 Jul 2014Listed for Sale OFFERS ABOVE $580,000
- 21 Mar 2006Sold for $325,000

Recent sales nearby
See more recent sales nearbySimilar properties For Sale nearby
See more properties for sale nearby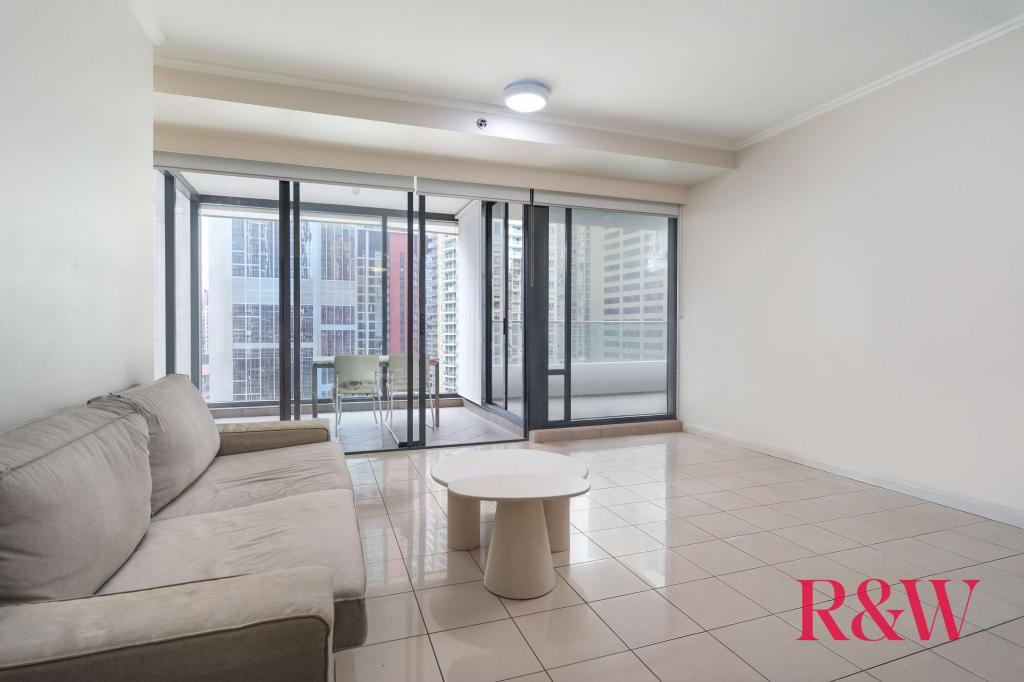 0
0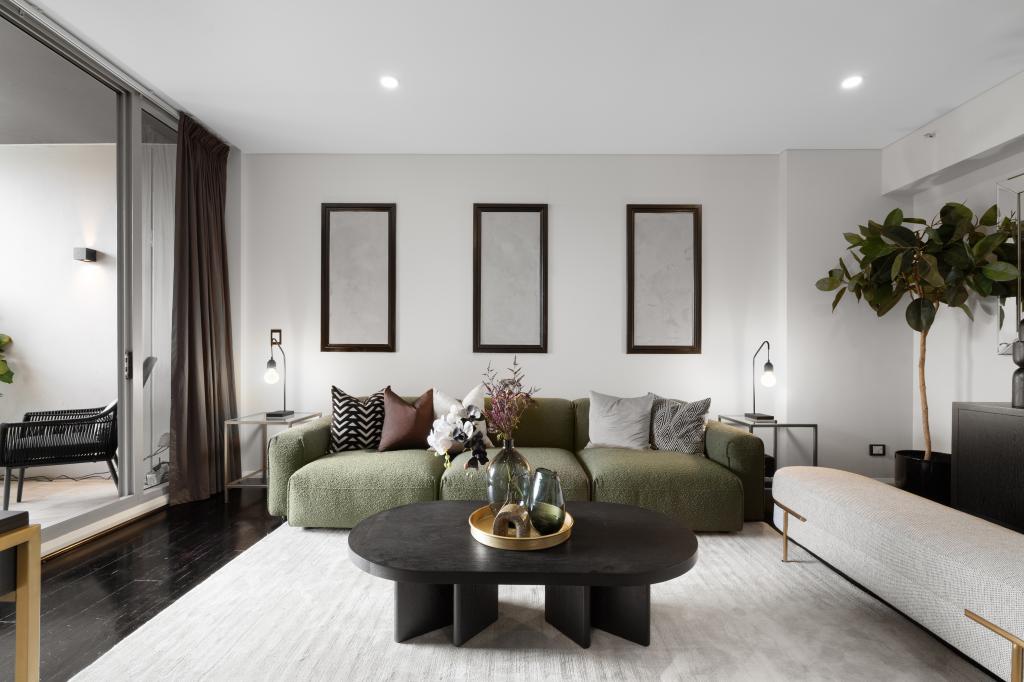 0
0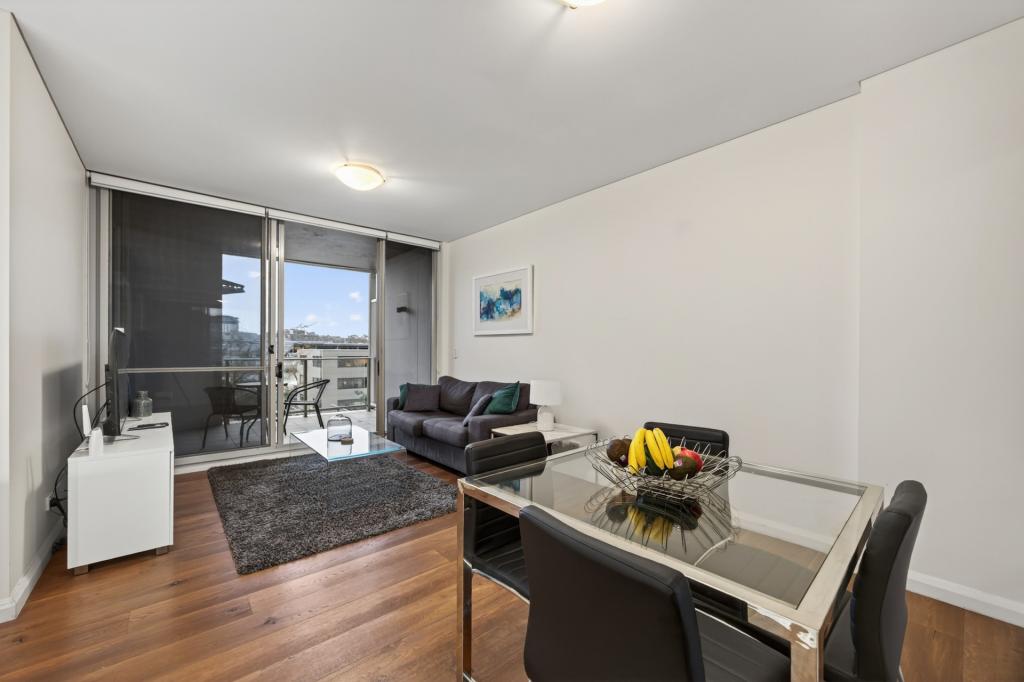 0
0Similar properties For Rent nearby
See more properties for rent nearby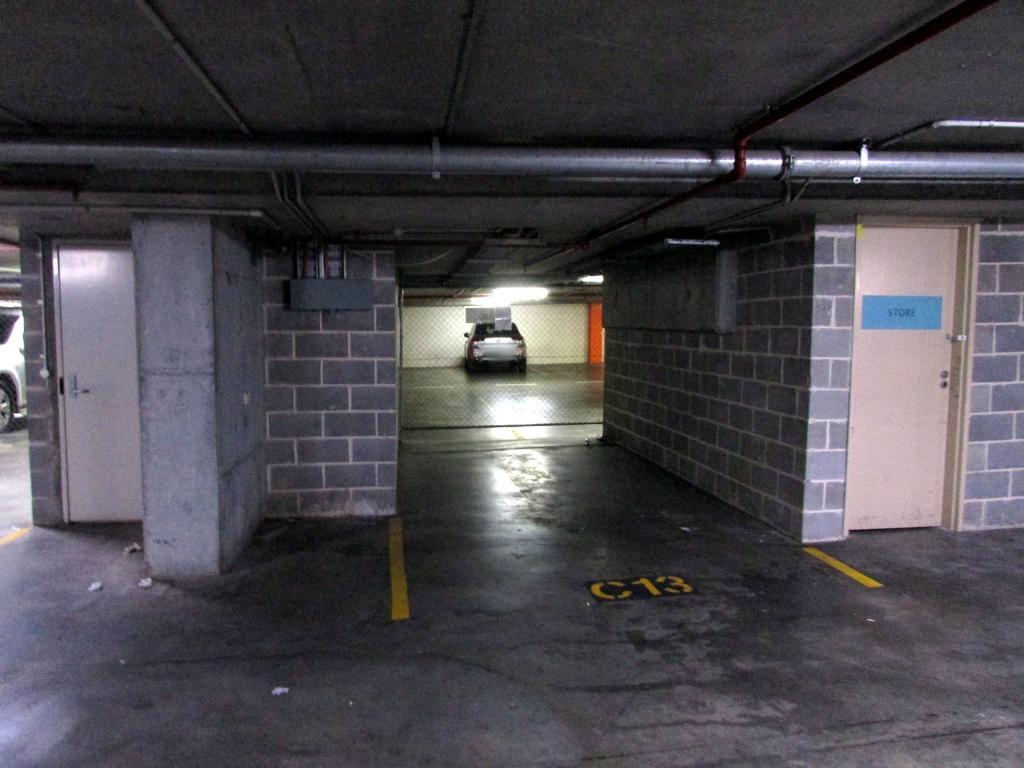 0
0 0
0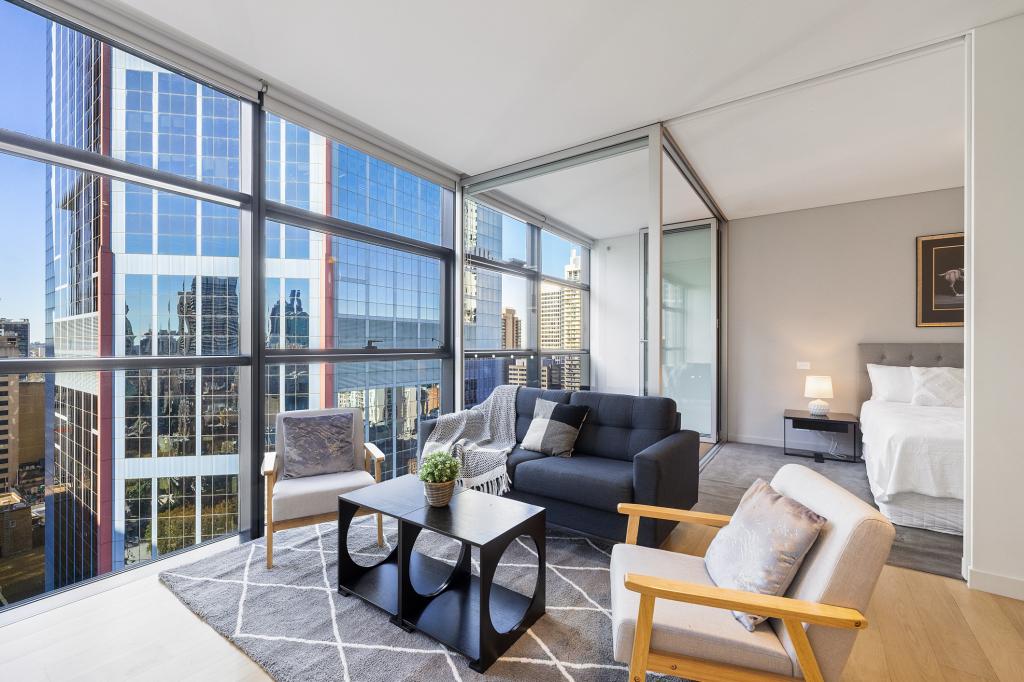 0
0About Sydney 2000
The size of Sydney is approximately 3.0 square kilometres. There are 16 parks, covering nearly 33.5% of the total area. The population of Sydney in 2016 was 17252 people. By 2021 the population was 16667 showing a population decline of 3.4% in the area during that time. The predominant age group in Sydney is 20-29 years. Households in Sydney are primarily childless couples and are likely to be repaying over $4000 per month on mortgage repayments. In general, people in Sydney work in a professional occupation.In 2021, 24.20% of the homes in Sydney were owner-occupied compared with 29.10% in 2016.
Sydney has 24,403 properties. Over the last 5 years, Houses in Sydney have seen a 68.33% increase in median value, while Units have seen a -4.15% decrease. As at 31 May 2026:
- The median value for Houses in Sydney is $2,366,610 while the median value for Units is $1,079,740.
- Units have a median rent of $1,000.
Suburb Insights for Sydney 2000
Market Insights
Sydney Trends for Houses
N/A
N/A
View TrendN/A
N/A
Sydney Trends for Units
N/A
N/A
View TrendN/A
N/A
Neighbourhood Insights
© Copyright 2026. RP Data Pty Ltd trading as Cotality (Cotality). All rights reserved. No reproduction, distribution, or transmission of the copyrighted materials is permitted. The information is deemed reliable but not guaranteed.
While Cotality uses commercially reasonable efforts to ensure the Cotality Data is current, Cotality does not warrant the accuracy, currency or completeness of the Cotality Data and to the full extent permitted by law excludes all loss or damage howsoever arising (including through negligence) in connection with the Cotality Data.
This product uses cookies and other similar technologies to improve and customise your browsing experience, to tailor content and adverts, and for analytics and metrics regarding visitor usage on this product and other media. We may share cookie and analytics information with third parties for the purposes of advertising. By continuing to use our website, you consent to cookies being used. View our Privacy Policy here.
X