
Property Details for 13 Clarendon Rd, Stanmore
13 Clarendon Rd, Stanmore is a 4 bedroom, 2 bathroom House with 2 parking spaces and was built in 1910. While the property is not currently for sale or for rent, it was last sold in April 2023.
Last Listing description (January 2025)
SITUATED IN A PERFECTLY CONVENIENT LOCATION!!
This freestanding family home has been meticulously updated. Only walking distance to Weekley Park, Stanmore Village, Primary school, Train Station, a selection of gourmet local eateries and all other amenities! Property features:
* Four generous bedrooms with built-ins
* Master bedroom with ensuite bathroom
* Contemporary Island kitchen with dishwasher and gas cooking
* Timber flooring throughout the property
* Separate dining and living area offer a flexible layout
Secure parking with 2 car - LUG with storage; Internal laundry - with ducted airconditioner
Available Now Contact Tarik for further details or inspection Thank you for reaching out!
Property History for 13 Clarendon Rd, Stanmore, NSW 2048
- 03 Dec 2024Listed for Rent $1,600 pw
- 06 Mar 2023Listed for Sale Sold Prior to Auction | Price Withheld
- 06 Mar 2023Listed for Rent $1,400 per week

Recent sales nearby
See more recent sales nearby
Similar properties For Sale nearby
See more properties for sale nearby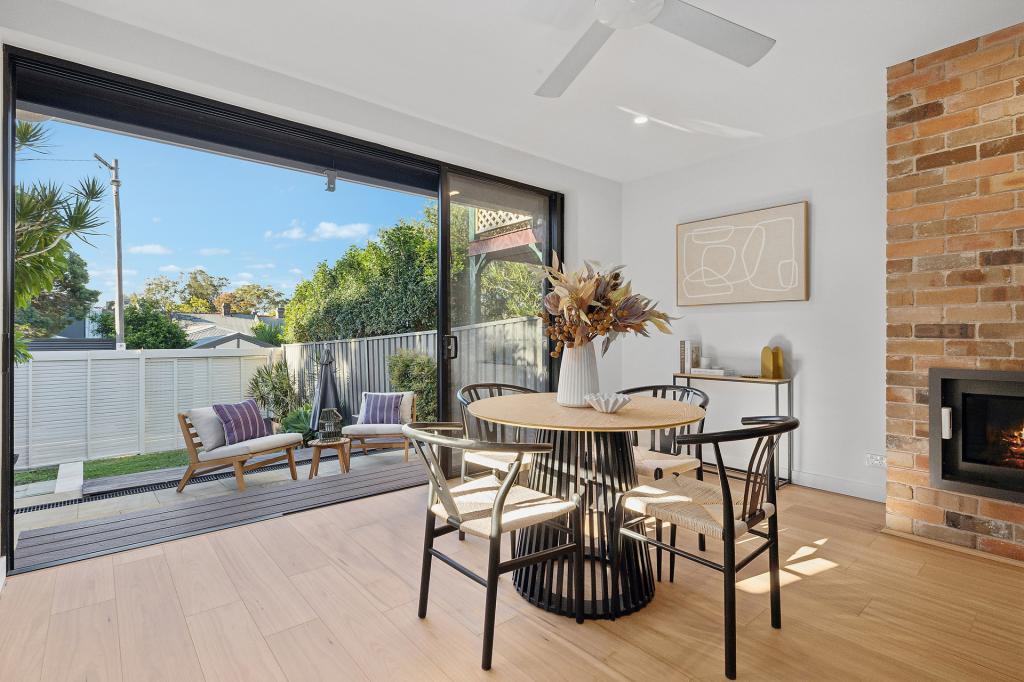 0
0 0
0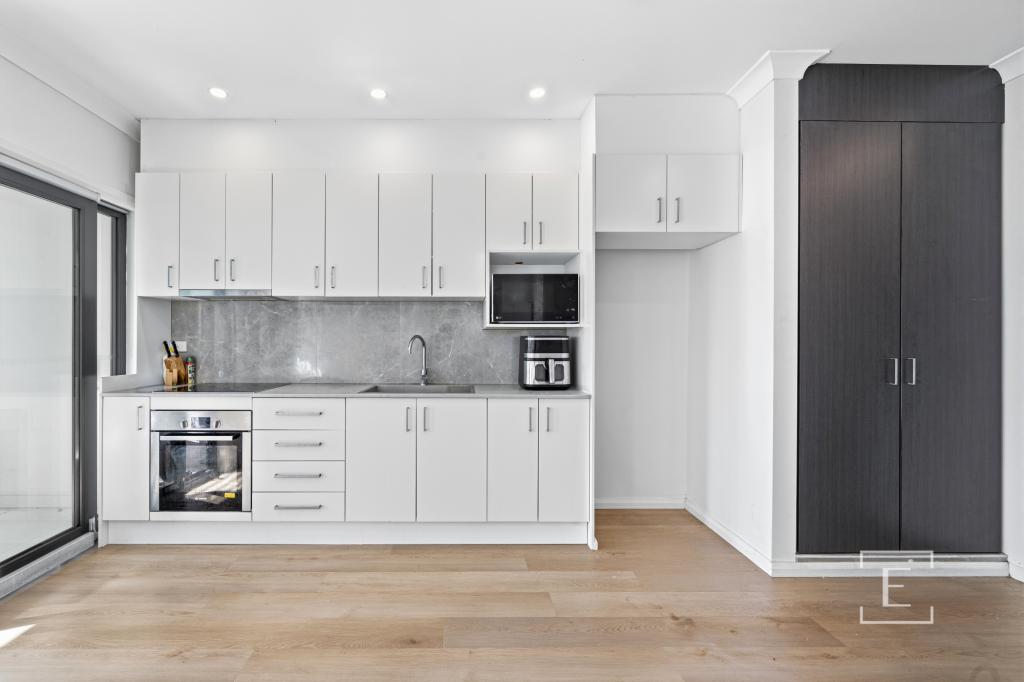 0
0Similar properties For Rent nearby
See more properties for rent nearby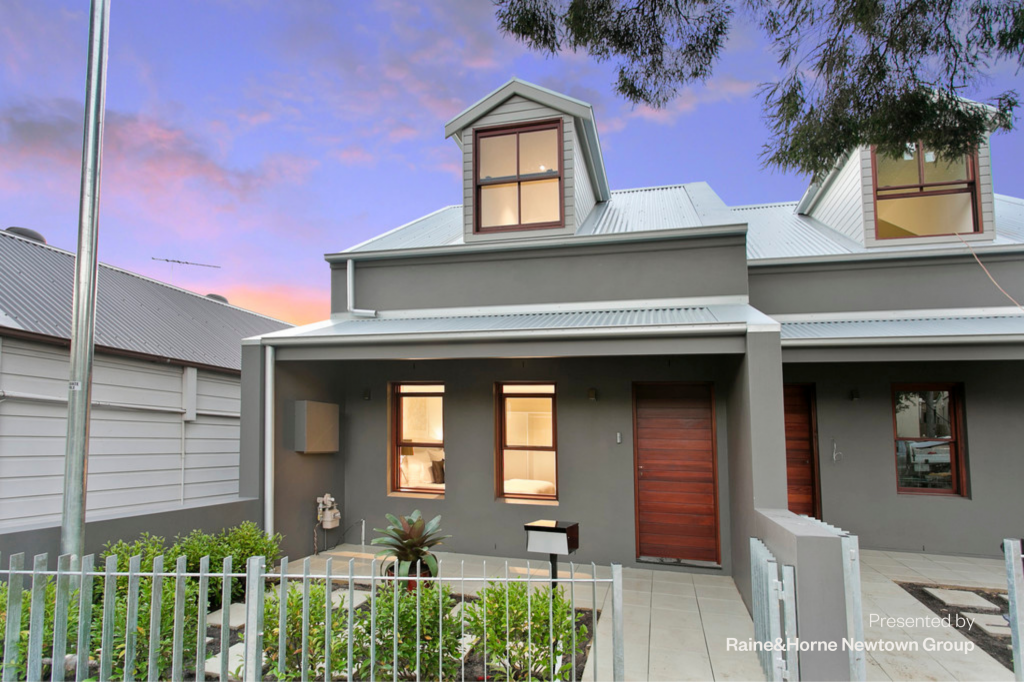 0
0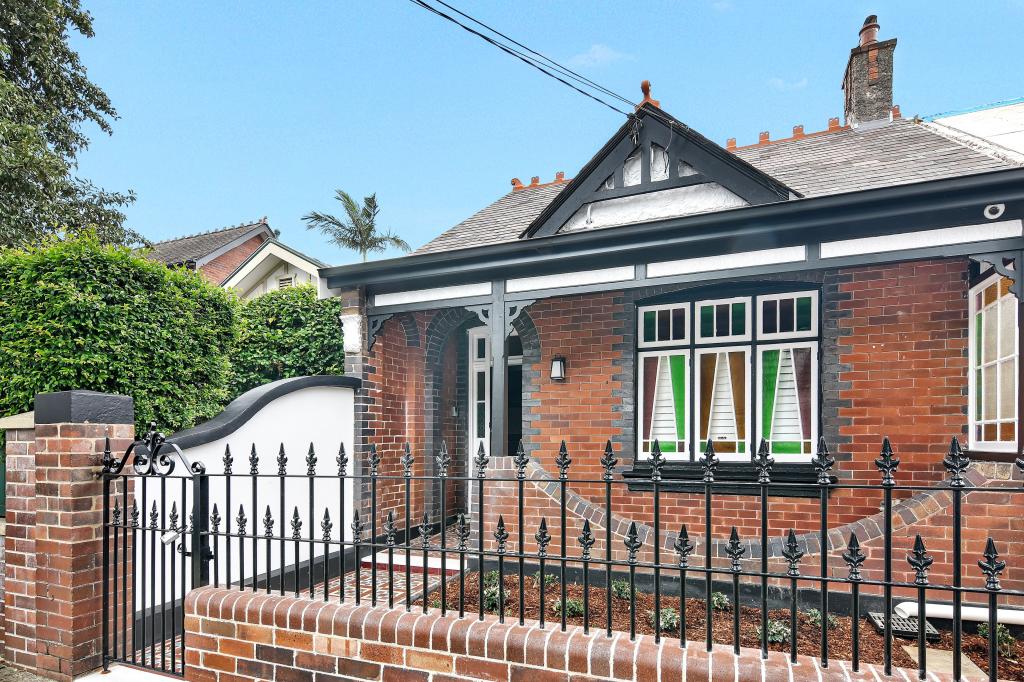 0
0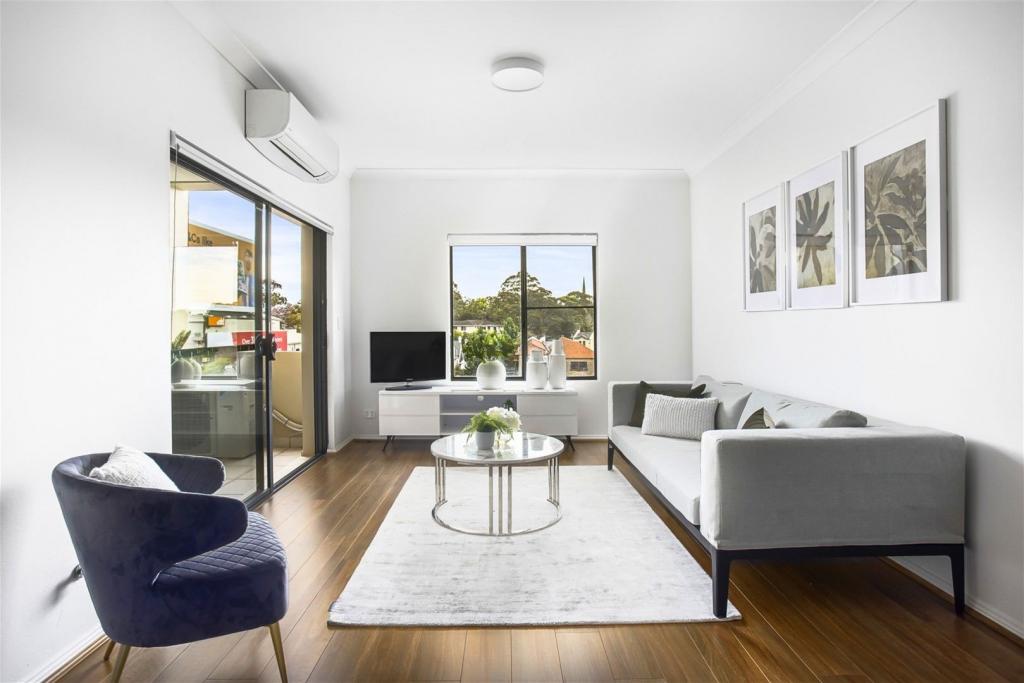 0
0About Stanmore 2048
The size of Stanmore is approximately 1.2 square kilometres. It has 11 parks covering nearly 4.1% of total area. The population of Stanmore in 2016 was 7938 people. By 2021 the population was 7619 showing a population decline of 4.0% in the area during that time. The predominant age group in Stanmore is 20-29 years. Households in Stanmore are primarily childless couples and are likely to be repaying over $4000 per month on mortgage repayments. In general, people in Stanmore work in a professional occupation.In 2021, 52.70% of the homes in Stanmore were owner-occupied compared with 51.00% in 2016.
Stanmore has 4,061 properties. Over the last 5 years, Houses in Stanmore have seen a 23.55% increase in median value, while Units have seen a 28.73% increase. As at 30 April 2026:
- The median value for Houses in Stanmore is $2,363,688 while the median value for Units is $973,627.
- Houses have a median rent of $1,180 while Units have a median rent of $650.
Suburb Insights for Stanmore 2048
Market Insights
Stanmore Trends for Houses
N/A
N/A
View TrendN/A
N/A
Stanmore Trends for Units
N/A
N/A
View TrendN/A
N/A
Neighbourhood Insights
© Copyright 2026. RP Data Pty Ltd trading as Cotality (Cotality). All rights reserved. No reproduction, distribution, or transmission of the copyrighted materials is permitted. The information is deemed reliable but not guaranteed.
While Cotality uses commercially reasonable efforts to ensure the Cotality Data is current, Cotality does not warrant the accuracy, currency or completeness of the Cotality Data and to the full extent permitted by law excludes all loss or damage howsoever arising (including through negligence) in connection with the Cotality Data.
This product uses cookies and other similar technologies to improve and customise your browsing experience, to tailor content and adverts, and for analytics and metrics regarding visitor usage on this product and other media. We may share cookie and analytics information with third parties for the purposes of advertising. By continuing to use our website, you consent to cookies being used. View our Privacy Policy here.
X