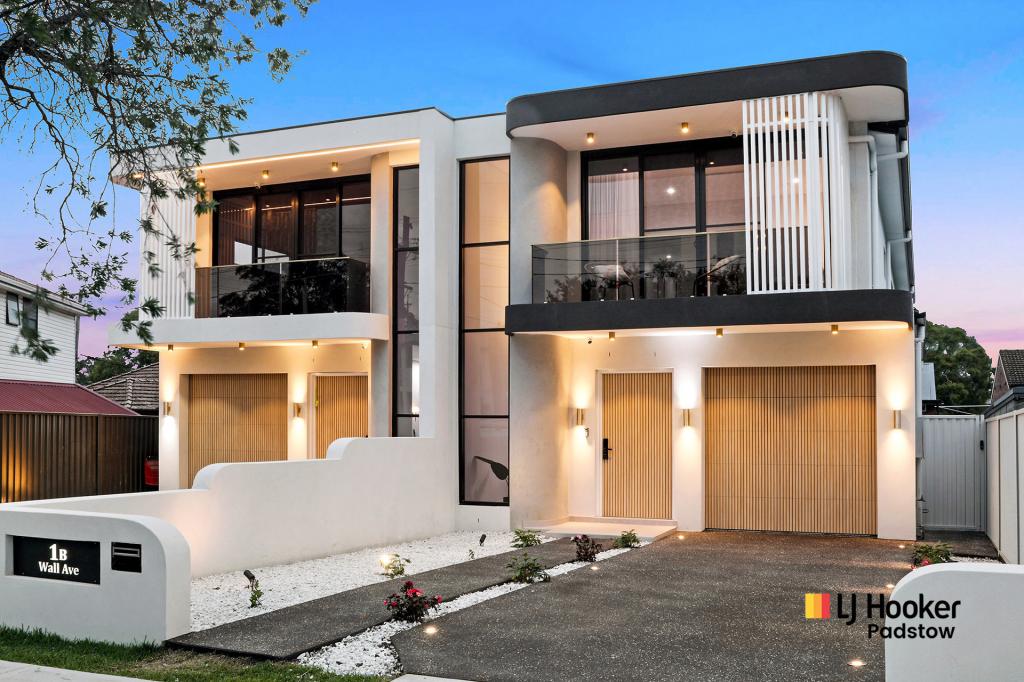
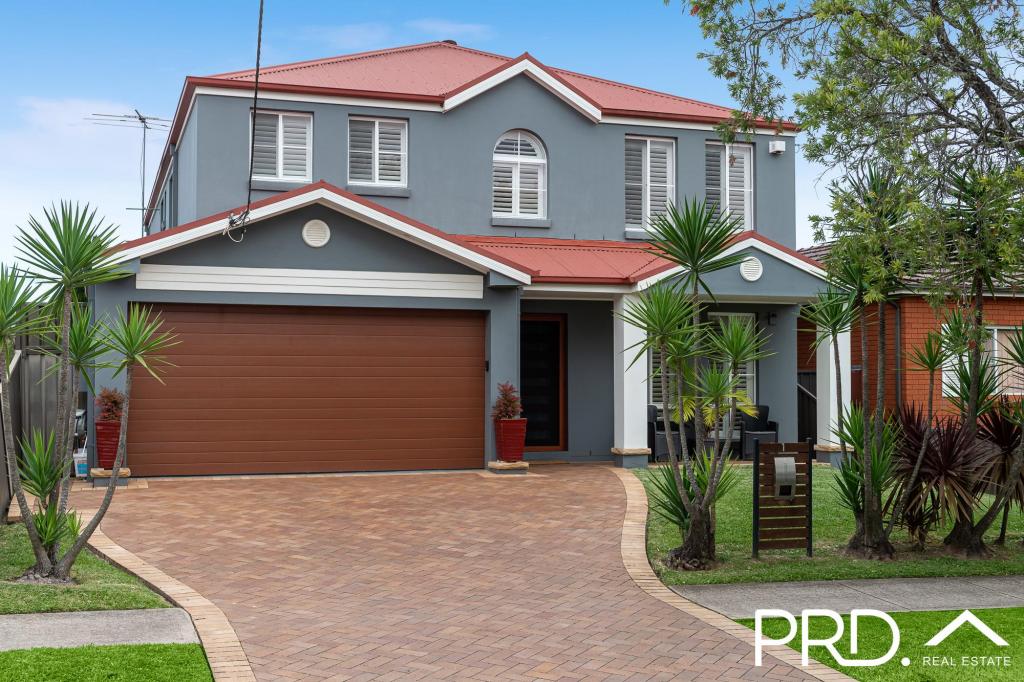
36A Picnic Point RoadPanania NSW 2213

Thinking about insurance?
Get estimated rebuild costs for this property with Sum SureProperty Details for 36a Picnic Point Rd, Panania
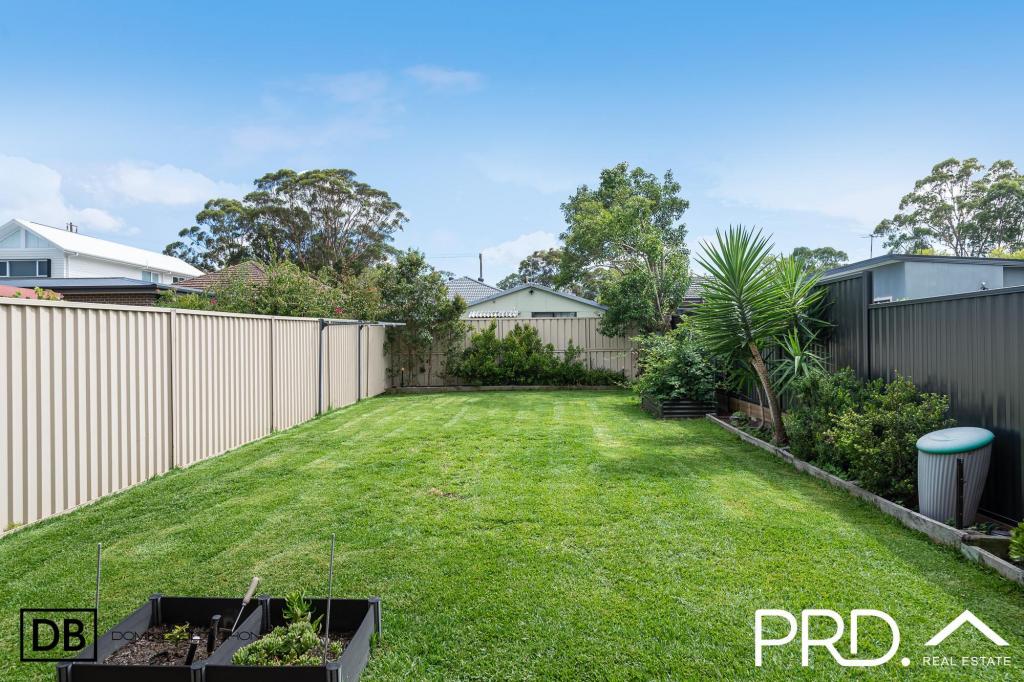
36a Picnic Point Rd, Panania is a 5 bedroom, 2 bathroom House and was built in 2023. The property has a land size of 288m2 and floor size of 241m2. While the property is not currently for sale or for rent, it was last sold in August 2023.
Property History for 36a Picnic Point Rd, Panania, NSW 2213
- 02 Aug 2023Sold for $1,532,000
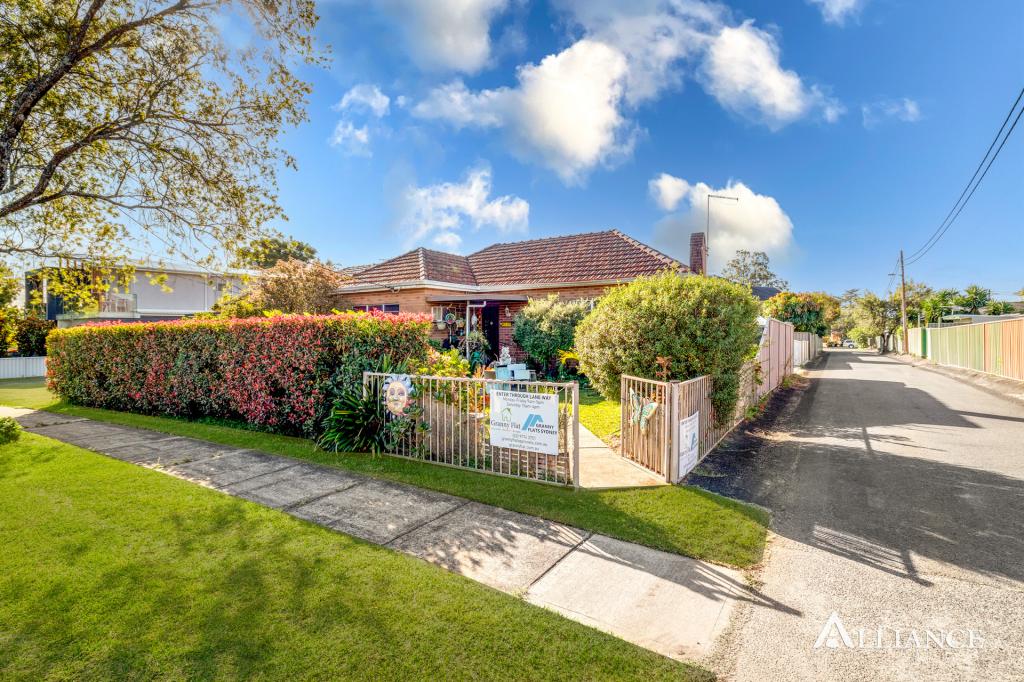
Recent sales nearby
See more recent sales nearby
Similar properties For Sale nearby
See more properties for sale nearby


Similar properties For Rent nearby
See more properties for rent nearby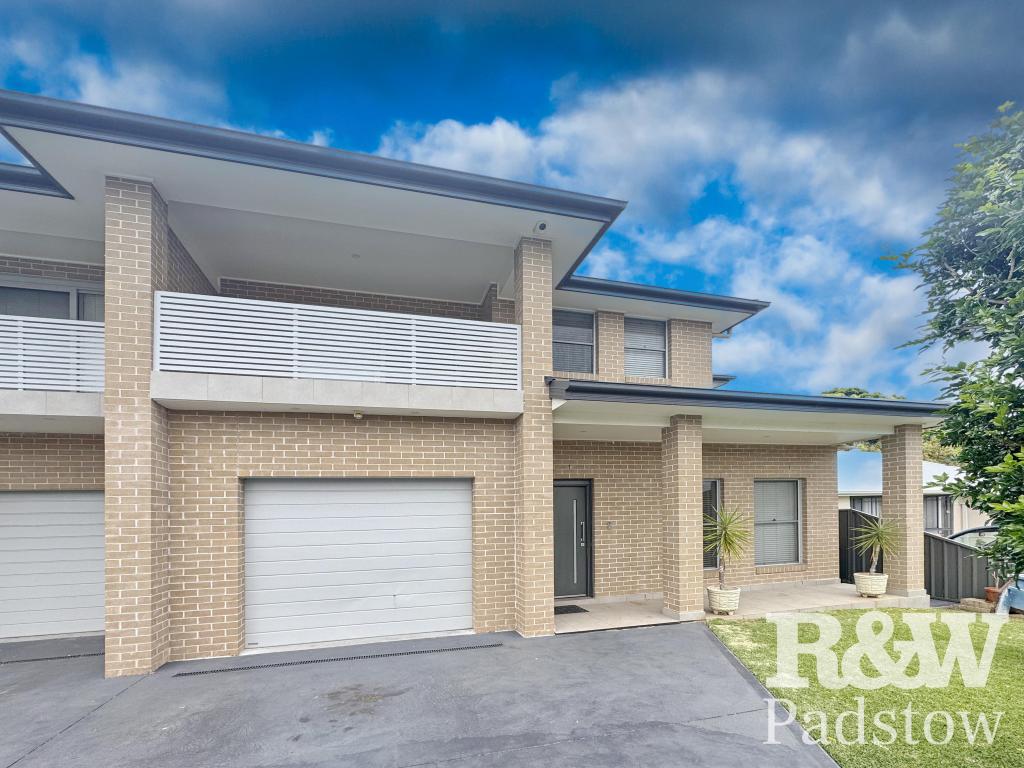

About Panania 2213
The size of Panania is approximately 4.7 square kilometres. It has 21 parks covering nearly 15.8% of total area. The population of Panania in 2011 was 11,489 people. By 2016 the population was 12,428 showing a population growth of 8.2% in the area during that time. The predominant age group in Panania is 40-49 years. Households in Panania are primarily couples with children and are likely to be repaying $1800 - $2399 per month on mortgage repayments. In general, people in Panania work in a professional occupation. In 2011, 72.6% of the homes in Panania were owner-occupied compared with 69.7% in 2016.
Panania has 5,388 properties. Over the last 5 years, Houses in Panania have seen a 56.77% increase in median value, while Units have seen a 38.94% increase. As at 30 April 2025:
- The median value for Houses in Panania is $1,529,171 while the median value for Units is $991,323.
- Houses have a median rent of $850 while Units have a median rent of $610.
What's around 36a Picnic Point Rd, Panania
36a Picnic Point Rd, Panania is in the school catchment zone for Panania Public School and East Hills Boys High School.


Suburb Insights for Panania 2213
Market Insights
Panania Trends for Houses
$1.53M
8.00%
View Trend$850/W
2.87%
Panania Trends for Units
$991k
7.20%
View Trend$610/W
3.59%
Neighbourhood Insights
Age
Population 12,428
0-9
14%
10-19
13%
20-29
12%
30-39
14%
40-49
14%
50-59
14%
60-69
10%
70-79
6%
80-89
4%
90-99
1%
Household Structure
Occupancy
© Copyright 2025 RP Data Pty Ltd trading as CoreLogic Asia Pacific (CoreLogic). All rights reserved.
This product uses cookies and other similar technologies to improve and customise your browsing experience, to tailor content and adverts, and for analytics and metrics regarding visitor usage on this product and other media. We may share cookie and analytics information with third parties for the purposes of advertising. By continuing to use our website, you consent to cookies being used. View our Privacy Policy here.
X