
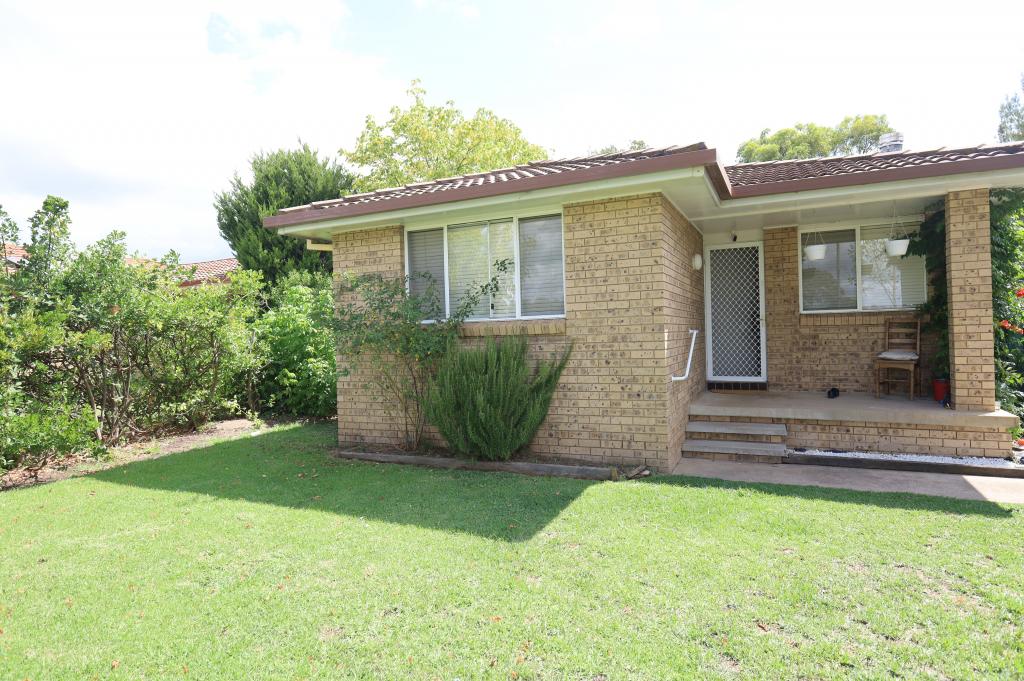
Property Details for 9 Crinoline St, Orange
9 Crinoline St, Orange is a 1 bedroom, 1 bathroom House and was built in 1992. While the property is not currently for sale or for rent, it was last sold in April 2025.
Last Listing description (December 2023)
Investment opportunity
If you're an astute investor looking for a strong return, 9 Crinoline Street is hard to beat.
The 6 bedrooms are individually leased out around $250 - $275 per week and have consistently had low vacancy over the last five years. This property makes for the perfect addition to any investment portfolio.
- Ideal for superannuation funds
- Six bedrooms each with its own bathroom
- 1.3km to Orange Showground, 2.0km to North Orange Shopping Centre and 4.9km to Orange CBD
*Property was photographed prior to tenancy
Property History for 9 Crinoline St, Orange, NSW 2800
- 19 Dec 2022Listed for Sale $899,000
- 23 Jun 2021Listed for Rent $260 per week
- 02 Mar 2021Listed for Rent $250 per week

Recent sales nearby
See more recent sales nearby
Similar properties For Sale nearby
See more properties for sale nearby
 0
0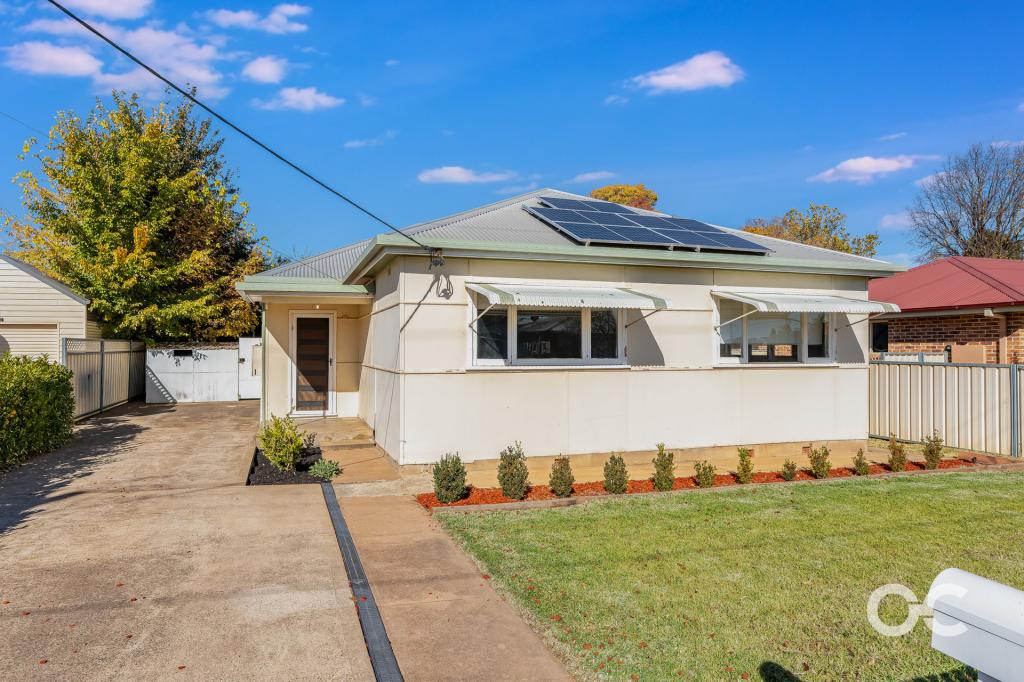 0
0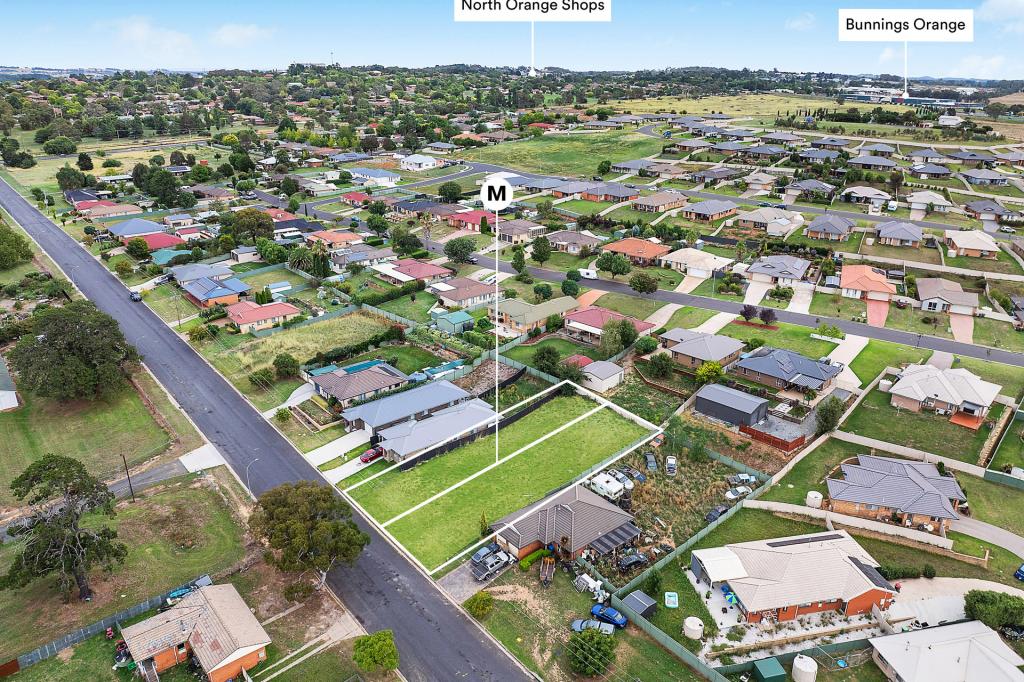 0
0Similar properties For Rent nearby
See more properties for rent nearby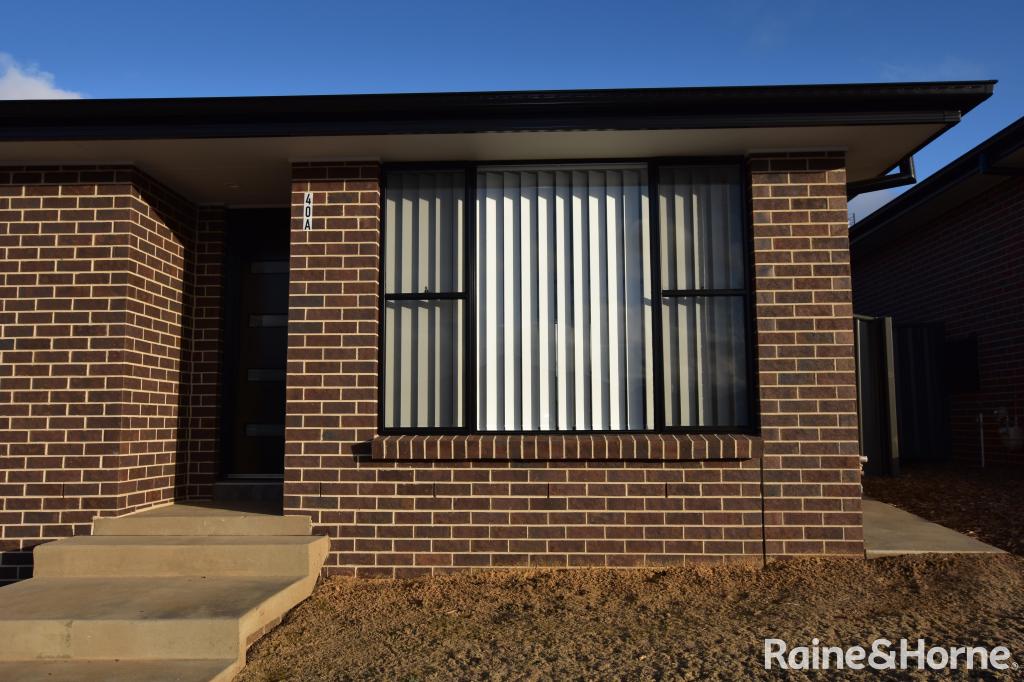 0
0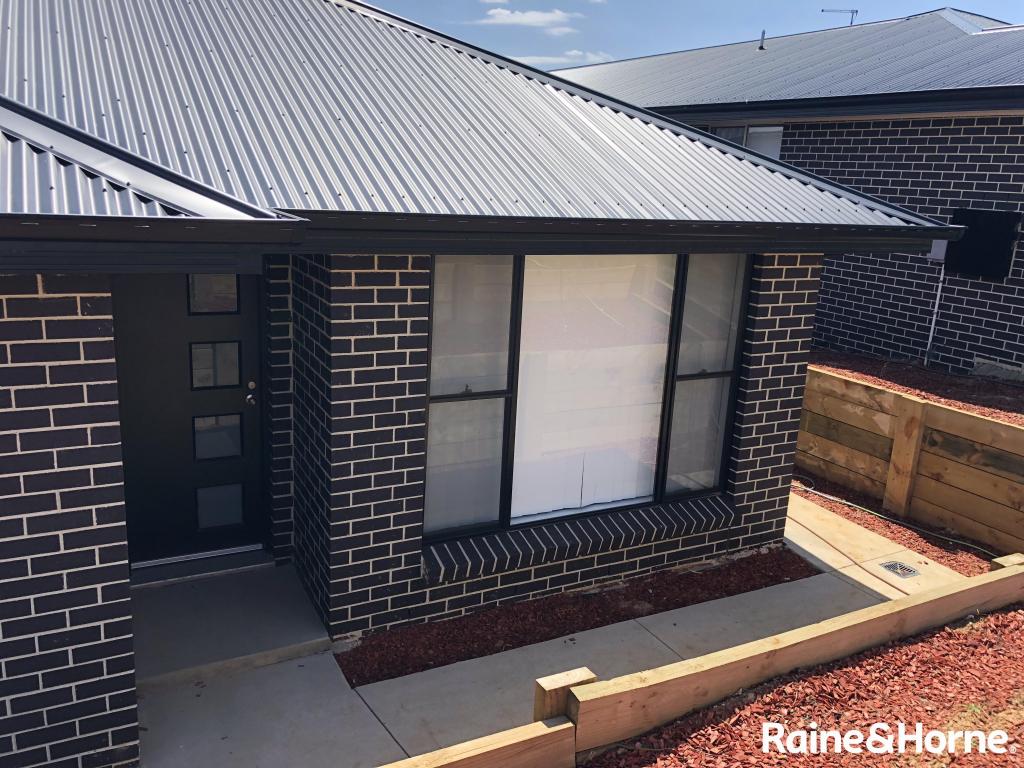 0
0 0
0About Orange 2800
The size of Orange is approximately 150.6 square kilometres. It has 98 parks covering nearly 4.0% of total area. The population of Orange in 2016 was 38097 people. By 2021 the population was 41232 showing a population growth of 8.2% in the area during that time. The predominant age group in Orange is 0-9 years. Households in Orange are primarily couples with children and are likely to be repaying $1400 - $1799 per month on mortgage repayments. In general, people in Orange work in a professional occupation.In 2021, 63.20% of the homes in Orange were owner-occupied compared with 61.80% in 2016.
Orange has 22,821 properties. Over the last 5 years, Houses in Orange have seen a 52.17% increase in median value, while Units have seen a 55.04% increase. As at 30 April 2026:
- The median value for Houses in Orange is $756,482 while the median value for Units is $511,155.
- Houses have a median rent of $585 while Units have a median rent of $470.
Suburb Insights for Orange 2800
Market Insights
Orange Trends for Houses
N/A
N/A
View TrendN/A
N/A
Orange Trends for Units
N/A
N/A
View TrendN/A
N/A
Neighbourhood Insights
© Copyright 2026. RP Data Pty Ltd trading as Cotality (Cotality). All rights reserved. No reproduction, distribution, or transmission of the copyrighted materials is permitted. The information is deemed reliable but not guaranteed.
While Cotality uses commercially reasonable efforts to ensure the Cotality Data is current, Cotality does not warrant the accuracy, currency or completeness of the Cotality Data and to the full extent permitted by law excludes all loss or damage howsoever arising (including through negligence) in connection with the Cotality Data.
This product uses cookies and other similar technologies to improve and customise your browsing experience, to tailor content and adverts, and for analytics and metrics regarding visitor usage on this product and other media. We may share cookie and analytics information with third parties for the purposes of advertising. By continuing to use our website, you consent to cookies being used. View our Privacy Policy here.
X