
1 Hume StreetMulwala NSW 2647
Property Details for 1 Hume St, Mulwala
1 Hume St, Mulwala is a 1 bedroom, 1 bathroom Unit and was built in 1995. The property has a land size of 994m2 and floor size of 140m2. While the property is not currently for sale or for rent, it was last sold in July 2006.
Last Listing description (May 2019)
Located in a highly sought Hume street in Mulwala are these 7 individually titled units. These 1 bedroom units contain a spacial living area, bathroom/laundry and are all separately metered. All units are all currently tenanted (returning $45,500 per annum) which is a great opportunity for any investor. To add this property to your portfolio be sure to contact our sales team on 5743 1400
Property History for 1 Hume St, Mulwala, NSW 2647
- 10 May 2019Listed for Sale $629,000
- 08 Nov 2018Listed for Sale $630,000
- 11 Oct 2013Listed for Sale $167,500 ONO

Recent sales nearby
See more recent sales nearby
Similar properties For Sale nearby
See more properties for sale nearby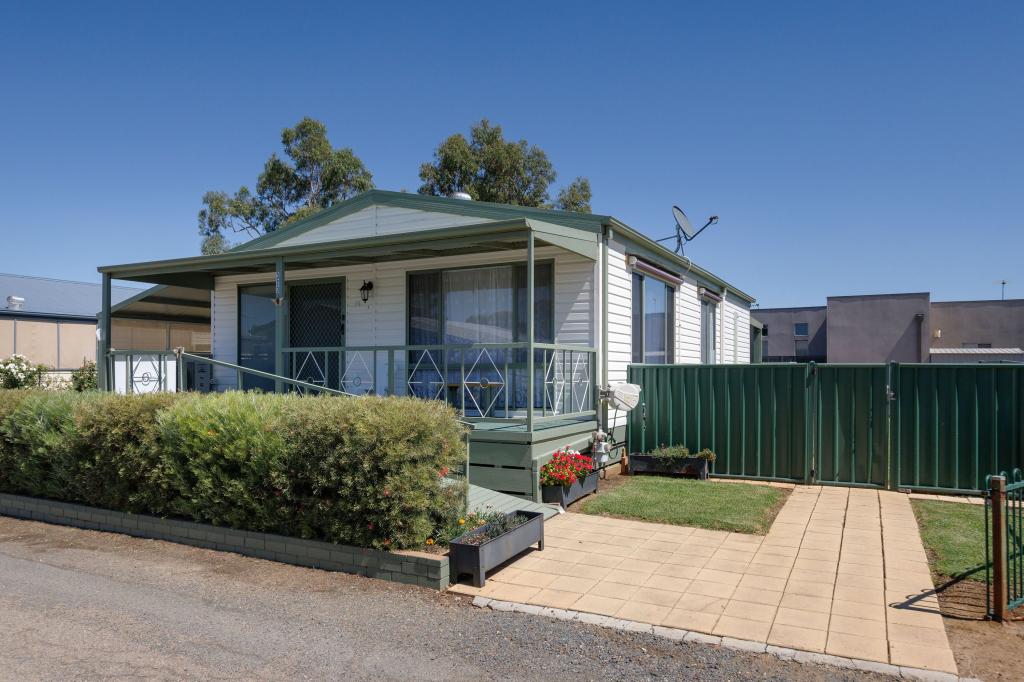 0
0 0
0 0
0Similar properties For Rent nearby
See more properties for rent nearby 0
0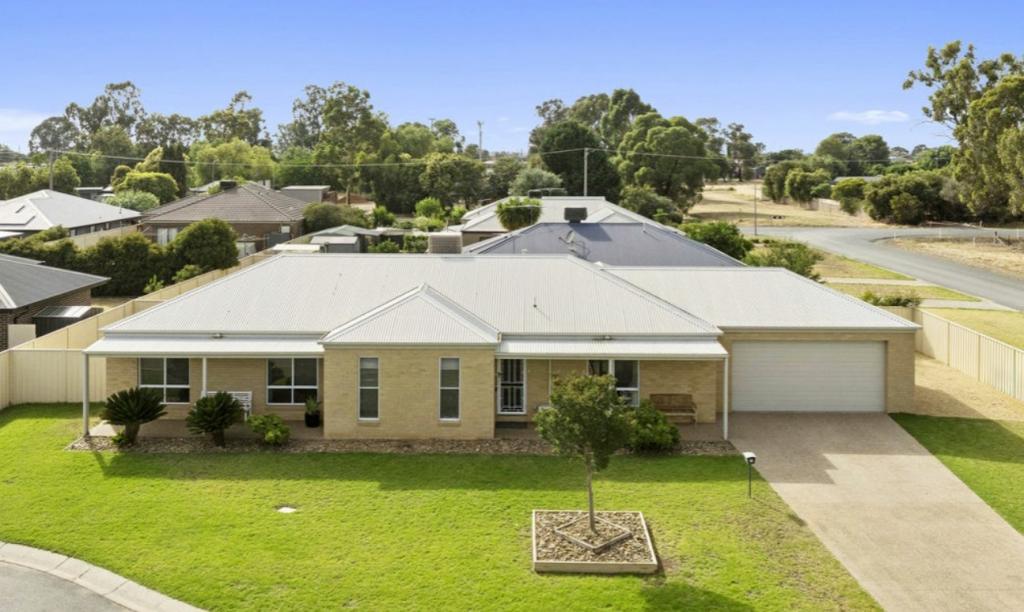 0
0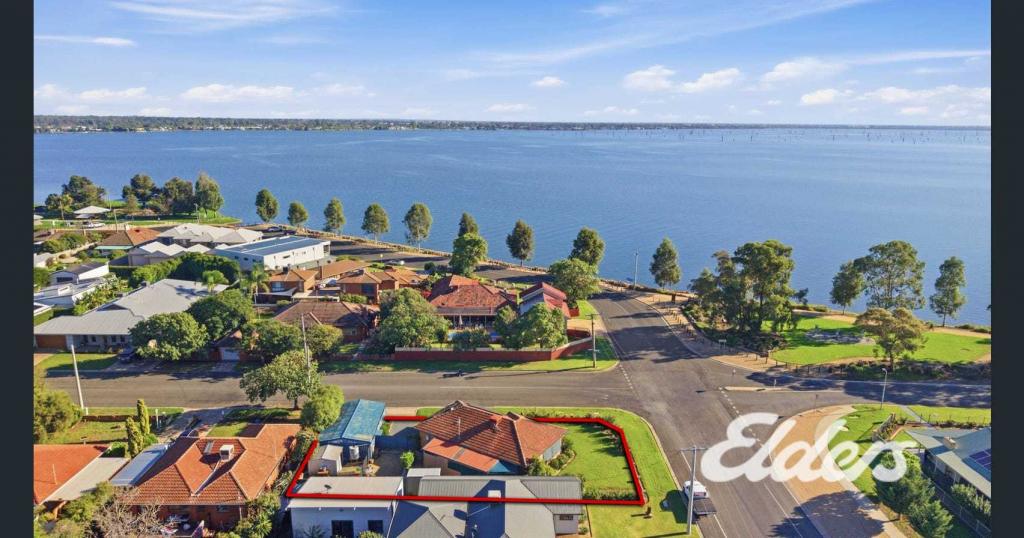 0
0About Mulwala 2647
The size of Mulwala is approximately 356.7 square kilometres. There are 15 parks, covering nearly 4.3% of the total area. The population of Mulwala in 2016 was 2161 people. By 2021 the population was 2557 showing a population growth of 18.3% in the area during that time. The predominant age group in Mulwala is 60-69 years. Households in Mulwala are primarily childless couples and are likely to be repaying $1400 - $1799 per month on mortgage repayments. In general, people in Mulwala work in a trades occupation.In 2021, 75.00% of the homes in Mulwala were owner-occupied compared with 72.60% in 2016.
Mulwala has 2,630 properties. Over the last 5 years, Houses in Mulwala have seen a 48.94% increase in median value, while Units have seen a 59.37% increase. As at 30 April 2026:
- The median value for Houses in Mulwala is $626,281 while the median value for Units is $449,892.
- Houses have a median rent of $540 while Units have a median rent of $380.
Suburb Insights for Mulwala 2647
Market Insights
Mulwala Trends for Houses
N/A
N/A
View TrendN/A
N/A
Mulwala Trends for Units
N/A
N/A
View TrendN/A
N/A
Neighbourhood Insights
© Copyright 2026. RP Data Pty Ltd trading as Cotality (Cotality). All rights reserved. No reproduction, distribution, or transmission of the copyrighted materials is permitted. The information is deemed reliable but not guaranteed.
While Cotality uses commercially reasonable efforts to ensure the Cotality Data is current, Cotality does not warrant the accuracy, currency or completeness of the Cotality Data and to the full extent permitted by law excludes all loss or damage howsoever arising (including through negligence) in connection with the Cotality Data.
This product uses cookies and other similar technologies to improve and customise your browsing experience, to tailor content and adverts, and for analytics and metrics regarding visitor usage on this product and other media. We may share cookie and analytics information with third parties for the purposes of advertising. By continuing to use our website, you consent to cookies being used. View our Privacy Policy here.
X