
8 Smith StreetMolong NSW 2866
Property Details for 8 Smith St, Molong
8 Smith St, Molong is a 4 bedroom, 2 bathroom House with 2 parking spaces and was built in 1980. While the property is not currently for sale or for rent, it was last sold in August 2025. There are other 4 bedroom House sold in Molong in the last 12 months.
Last Listing description (January 2017)
8 SMITH STREET MOLONG
THIS BEAUTIFULLY PRESENTED TWO LEVEL HOME IS A MUST SEE!3 BEDROOMS WITH BUILT INS.BATHROOM WITH SEPARATE TOILET.FORMAL LOUNGE AREA THAT OPENS ONTO A FULLY SECURE SUN-ROOM WHICH IS SCREENED FOR SUMMER AND BISTRO BLINDS FOR WINTER CAPTURING THE AMAZING COUNTRY VIEWS.WELL APPOINTED KITCHEN WITH FLOOR TO CEILING WINDOW AND A SERVING AREA.FAMILY ROOM WITH WOOD FIRE AND DINING AREA.LARGE GUESTROOM OR OFFICE WITH BATHROOM AND CORNER SPA UNIT .REMOTE GARAGE, DOUBLE CARPORT, UNDER HOUSE WALK IN STORAGE OR WORKSHOP.NEWLY TILED VERANDAS WITH ENTERTAINMENT AREA AND WELL ESTABLISHED GARDENS.THIS HOME HAS MANY MANY FEATURES TOO MANY TO LIST.CLOSE TO SCHOOLS AND SHOP.
Property History for 8 Smith St, Molong, NSW 2866
- 17 Jan 2017Listed for Sale $350,000
- 26 Aug 2015Listed for Sale $350,000
- 02 Apr 2011Listed for Sale OFFERS OVER $300,000

Recent sales nearby
See more recent sales nearbySimilar properties For Sale nearby
See more properties for sale nearby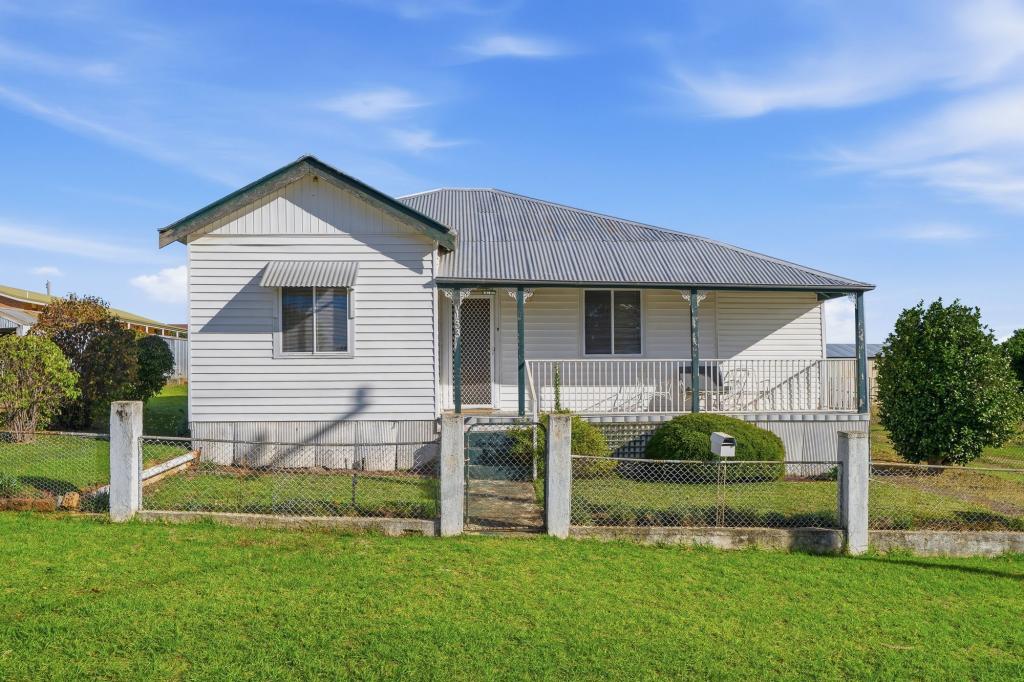 0
0 0
0
 0
0About Molong 2866
The size of Molong is approximately 425.3 square kilometres. There are 2 parks within the area. The population of Molong in 2016 was 2577 people. By 2021 the population was 2595 showing a population growth of 0.7% in the area during that time. The predominant age group in Molong is 10-19 years. Households in Molong are primarily couples with children and are likely to be repaying $1800 - $2399 per month on mortgage repayments. In general, people in Molong work in a managers occupation.In 2021, 73.80% of the homes in Molong were owner-occupied compared with 71.20% in 2016.
Molong has 1,517 properties. Over the last 5 years, Houses in Molong have seen a 57.33% increase in median value, while Units have seen a 59.08% increase. As at 30 June 2026:
- The median value for Houses in Molong is $549,459 while the median value for Units is $525,301.
- Houses have a median rent of $480.
Suburb Insights for Molong 2866
Market Insights
Molong Trends for Houses
N/A
N/A
View TrendN/A
N/A
Molong Trends for Units
N/A
N/A
View TrendN/A
N/A
Neighbourhood Insights
© Copyright 2026. RP Data Pty Ltd trading as Cotality (Cotality). All rights reserved. No reproduction, distribution, or transmission of the copyrighted materials is permitted. The information is deemed reliable but not guaranteed.
While Cotality uses commercially reasonable efforts to ensure the Cotality Data is current, Cotality does not warrant the accuracy, currency or completeness of the Cotality Data and to the full extent permitted by law excludes all loss or damage howsoever arising (including through negligence) in connection with the Cotality Data.
This product uses cookies and other similar technologies to improve and customise your browsing experience, to tailor content and adverts, and for analytics and metrics regarding visitor usage on this product and other media. We may share cookie and analytics information with third parties for the purposes of advertising. By continuing to use our website, you consent to cookies being used. View our Privacy Policy here.
X