
49 Hill StreetMolong NSW 2866
Property Details for 49 Hill St, Molong
49 Hill St, Molong is a 3 bedroom, 1 bathroom House with 2 parking spaces. The property has a land size of 1981m2 and floor size of 117m2. While the property is not currently for sale or for rent, it was last sold in January 2018.
Last Listing description (March 2018)
A fully renovated cottage with modern comforts, all the hard work has been done inside and out, you will love the open plan living with a brand new kitchen overlooking the family room.
1950s Classic weatherboard home
Brand new floor coverings & freshly painted throughout
3 bedroom all with ceiling fans two with built ins
New covered deck area great out door entertaining
Split system air conditioning
New 6m x 6m Double garage with concrete floor
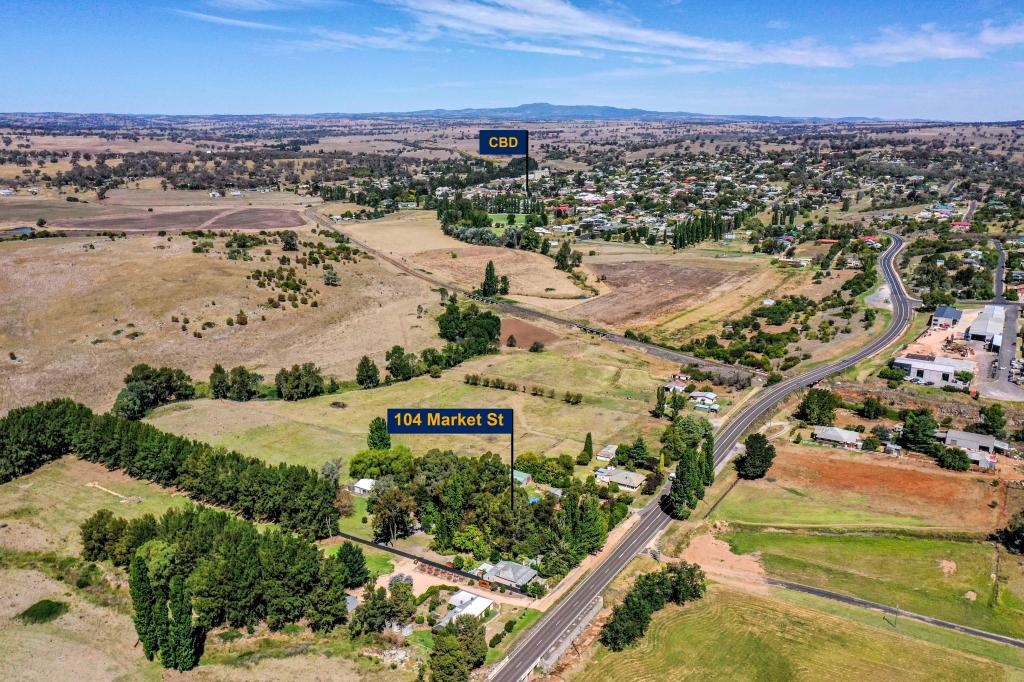
Huge yard approx. 1948 sqm with rear lane access
Call Mark Howes for further details 0467 604470
Property History for 49 Hill St, Molong, NSW 2866
- 28 Jan 2018Listed for Sale $320,000
- 24 Jan 2018Sold for $305,000

Recent sales nearby
See more recent sales nearbySimilar properties For Sale nearby
See more properties for sale nearby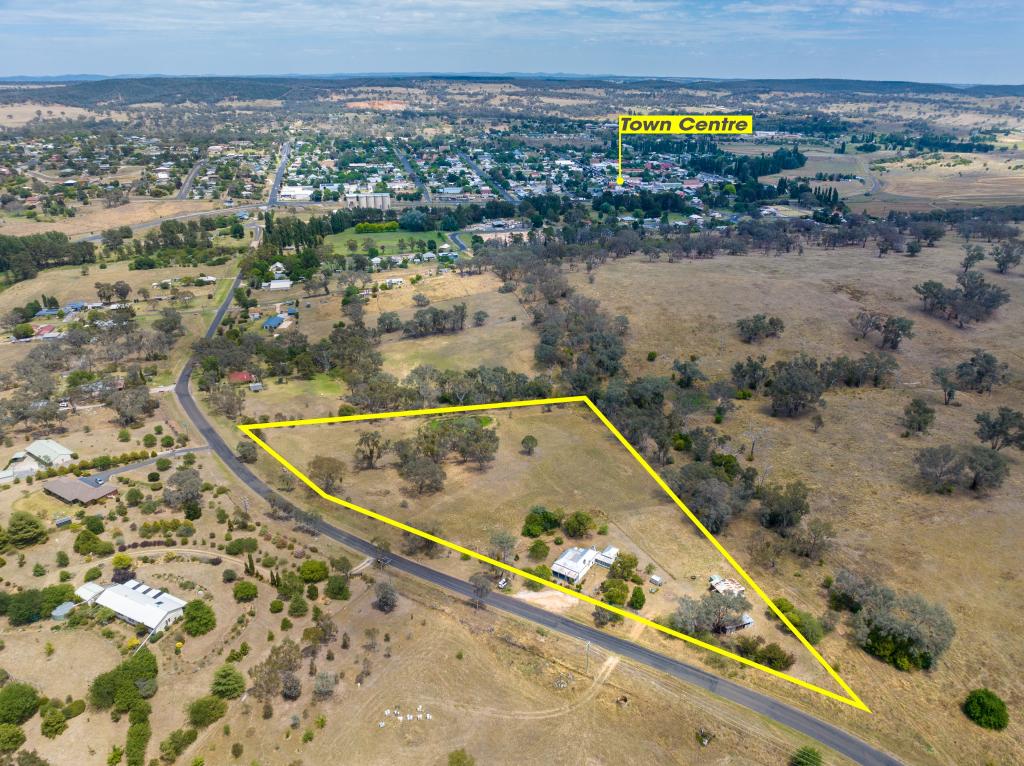 0
0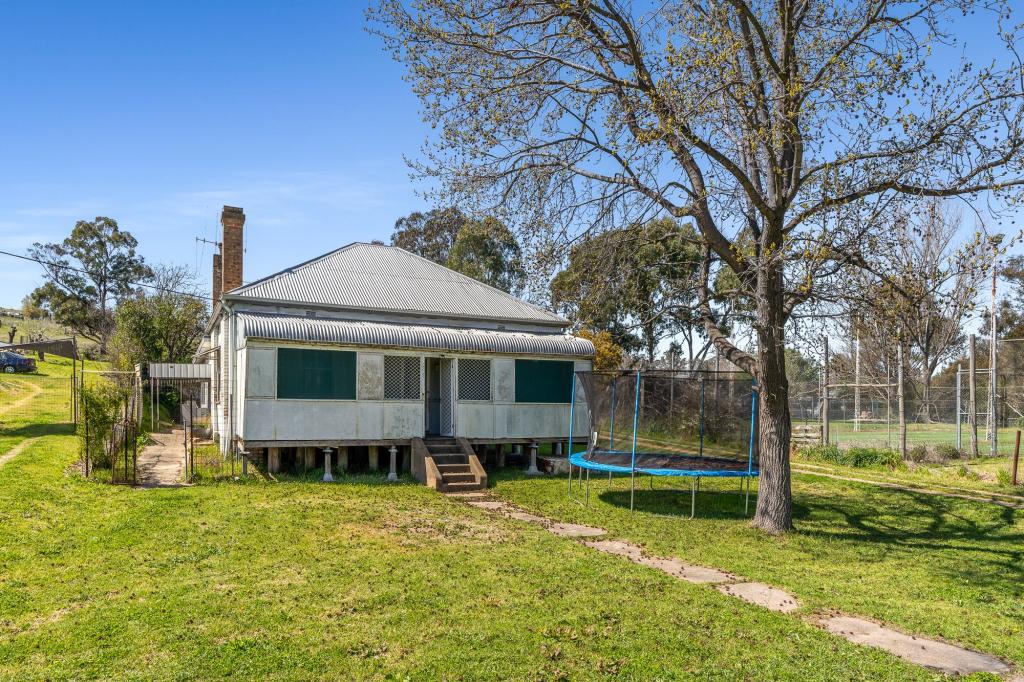 0
0
 0
0 0
0About Molong 2866
The size of Molong is approximately 425.3 square kilometres. It has 2 parks. The population of Molong in 2016 was 2577 people. By 2021 the population was 2595 showing a population growth of 0.7% in the area during that time. The predominant age group in Molong is 10-19 years. Households in Molong are primarily couples with children and are likely to be repaying $1800 - $2399 per month on mortgage repayments. In general, people in Molong work in a managers occupation.In 2021, 73.80% of the homes in Molong were owner-occupied compared with 71.20% in 2016.
Molong has 1,513 properties. Over the last 5 years, Houses in Molong have seen a 57.68% increase in median value, while Units have seen a 38.96% increase. As at 30 April 2026:
- The median value for Houses in Molong is $571,069 while the median value for Units is $510,037.
- Houses have a median rent of $468.
Suburb Insights for Molong 2866
Market Insights
Molong Trends for Houses
N/A
N/A
View TrendN/A
N/A
Molong Trends for Units
N/A
N/A
View TrendN/A
N/A
Neighbourhood Insights
© Copyright 2026. RP Data Pty Ltd trading as Cotality (Cotality). All rights reserved. No reproduction, distribution, or transmission of the copyrighted materials is permitted. The information is deemed reliable but not guaranteed.
While Cotality uses commercially reasonable efforts to ensure the Cotality Data is current, Cotality does not warrant the accuracy, currency or completeness of the Cotality Data and to the full extent permitted by law excludes all loss or damage howsoever arising (including through negligence) in connection with the Cotality Data.
This product uses cookies and other similar technologies to improve and customise your browsing experience, to tailor content and adverts, and for analytics and metrics regarding visitor usage on this product and other media. We may share cookie and analytics information with third parties for the purposes of advertising. By continuing to use our website, you consent to cookies being used. View our Privacy Policy here.
X