
28 Phillip StreetMolong NSW 2866
Property Details for 28 Phillip St, Molong
28 Phillip St, Molong is a 3 bedroom, 1 bathroom House with 2 parking spaces and was built in 1870. The property has a land size of 1012m2 and floor size of 125m2. While the property is not currently for sale or for rent, it was last sold in November 2014.
Last Listing description (May 2024)
This charming stone cottage, sitting on a large 1012m2 block features 3 bedrooms with as new carpet and paint, a spacious living room with timber floors and ceiling fan and a renovated bathroom with combined bath/ shower. The country style kitchen has ample storage with an electric oven and stove and a servery bar to the dining area. There's an internal laundry with more storage and a second toilet. In the backyard you'll find a huge established garden with a lockup storage shed and a 2 bay carport.
Property History for 28 Phillip St, Molong, NSW 2866
- 21 Apr 2024Listed for Rent $410 / week
- 16 Jan 2024Listed for Rent $420 / week
- 27 Jul 2022Listed for Rent $360 / week

Recent sales nearby
See more recent sales nearbySimilar properties For Sale nearby
See more properties for sale nearby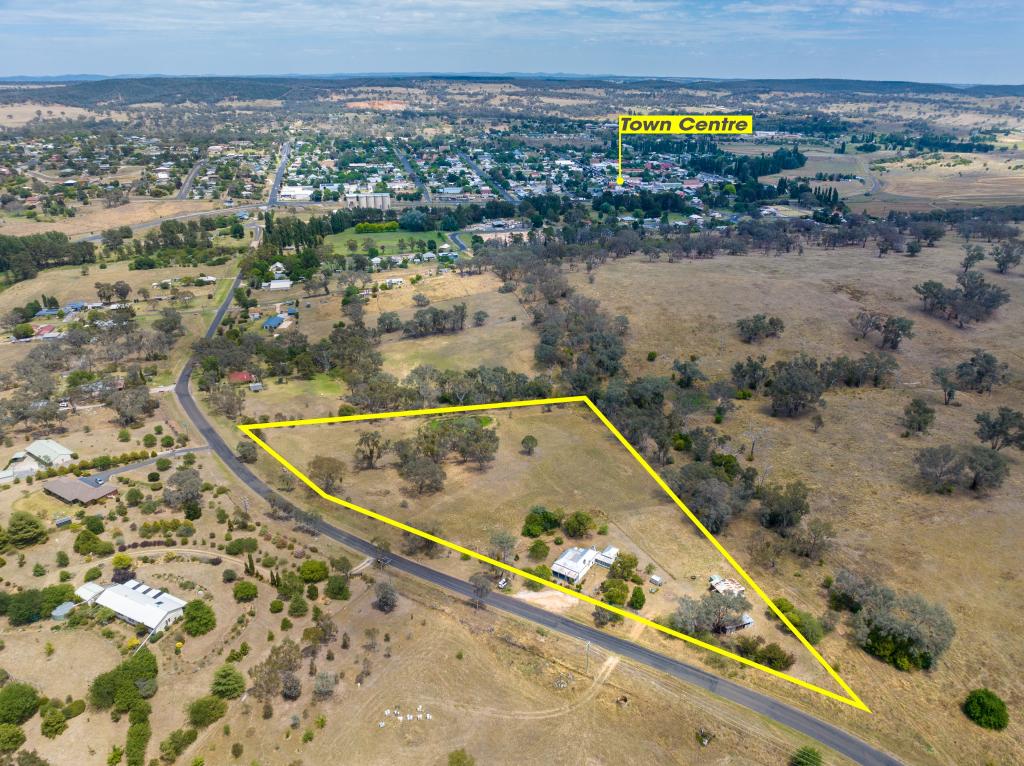 0
0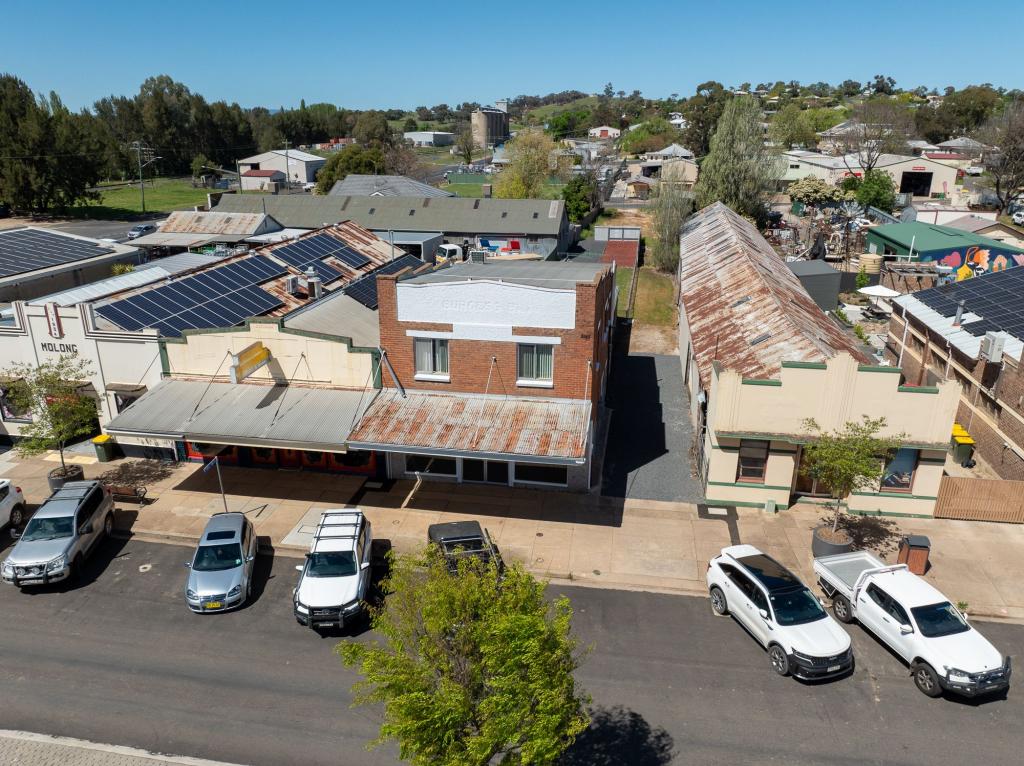 0
0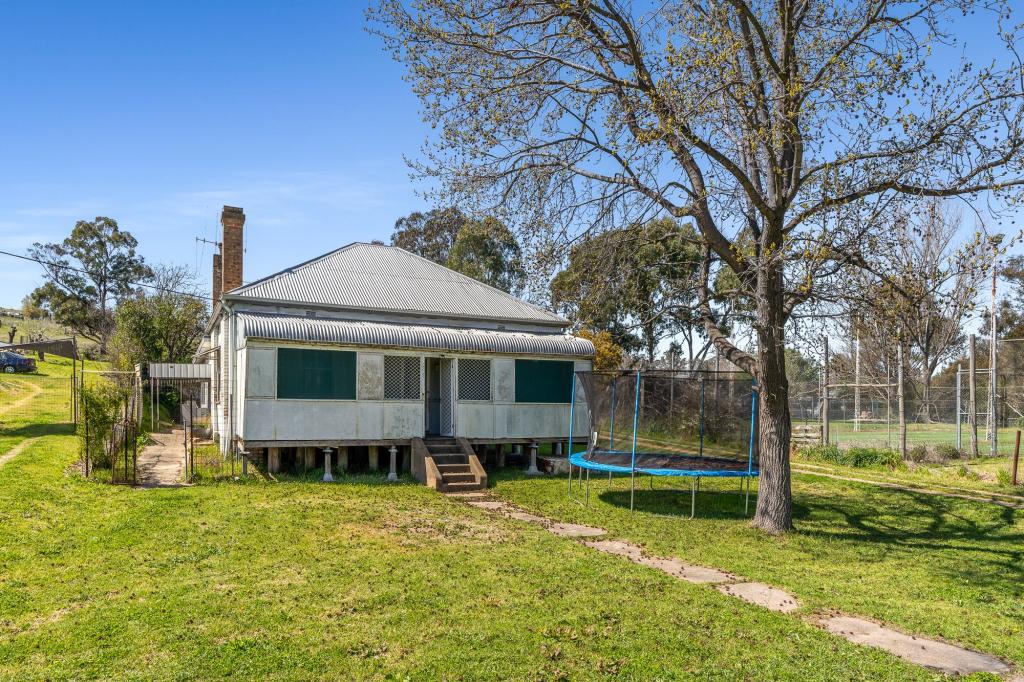 0
0About Molong 2866
The size of Molong is approximately 425.3 square kilometres. There are 2 parks within the area. The population of Molong in 2016 was 2577 people. By 2021 the population was 2595 showing a population growth of 0.7% in the area during that time. The predominant age group in Molong is 10-19 years. Households in Molong are primarily couples with children and are likely to be repaying $1800 - $2399 per month on mortgage repayments. In general, people in Molong work in a managers occupation.In 2021, 73.80% of the homes in Molong were owner-occupied compared with 71.20% in 2016.
Molong has 1,518 properties. Over the last 5 years, Houses in Molong have seen a 57.02% increase in median value, while Units have seen a 54.29% increase. As at 31 May 2026:
- The median value for Houses in Molong is $545,101 while the median value for Units is $509,766.
- Houses have a median rent of $470.
Suburb Insights for Molong 2866
Market Insights
Molong Trends for Houses
N/A
N/A
View TrendN/A
N/A
Molong Trends for Units
N/A
N/A
View TrendN/A
N/A
Neighbourhood Insights
© Copyright 2026. RP Data Pty Ltd trading as Cotality (Cotality). All rights reserved. No reproduction, distribution, or transmission of the copyrighted materials is permitted. The information is deemed reliable but not guaranteed.
While Cotality uses commercially reasonable efforts to ensure the Cotality Data is current, Cotality does not warrant the accuracy, currency or completeness of the Cotality Data and to the full extent permitted by law excludes all loss or damage howsoever arising (including through negligence) in connection with the Cotality Data.
This product uses cookies and other similar technologies to improve and customise your browsing experience, to tailor content and adverts, and for analytics and metrics regarding visitor usage on this product and other media. We may share cookie and analytics information with third parties for the purposes of advertising. By continuing to use our website, you consent to cookies being used. View our Privacy Policy here.
X