
115 Mitchell ParadeMollymook Beach NSW 2539
Property Details for 115 Mitchell Pde, Mollymook Beach
115 Mitchell Pde, Mollymook Beach is a 2 bedroom, 1 bathroom Unit. The property has a land size of 740m2. While the property is not currently for sale or for rent, it was last sold in May 2001.
Last Listing description (August 2022)
This 2 bedroom flat is perfectly positioned near North end of Mollymook Beach and only moments away from local shops and restaurants. This flat has on offer a newly renovated kitchen/bathroom, large covered outdoor entertaining deck, reverse cycle air-con, private laundry, carport and fenced yard with a vegetable/herb patch. Pets considered on application.
Property History for 115 Mitchell Pde, Mollymook Beach, NSW 2539
- 26 Jul 2022Listed for Rent $380 / week
- 24 Sep 2021Listed for Rent $380 / week
- 07 May 2001Sold for $243,000

Recent sales nearby
See more recent sales nearby
Similar properties For Sale nearby
See more properties for sale nearby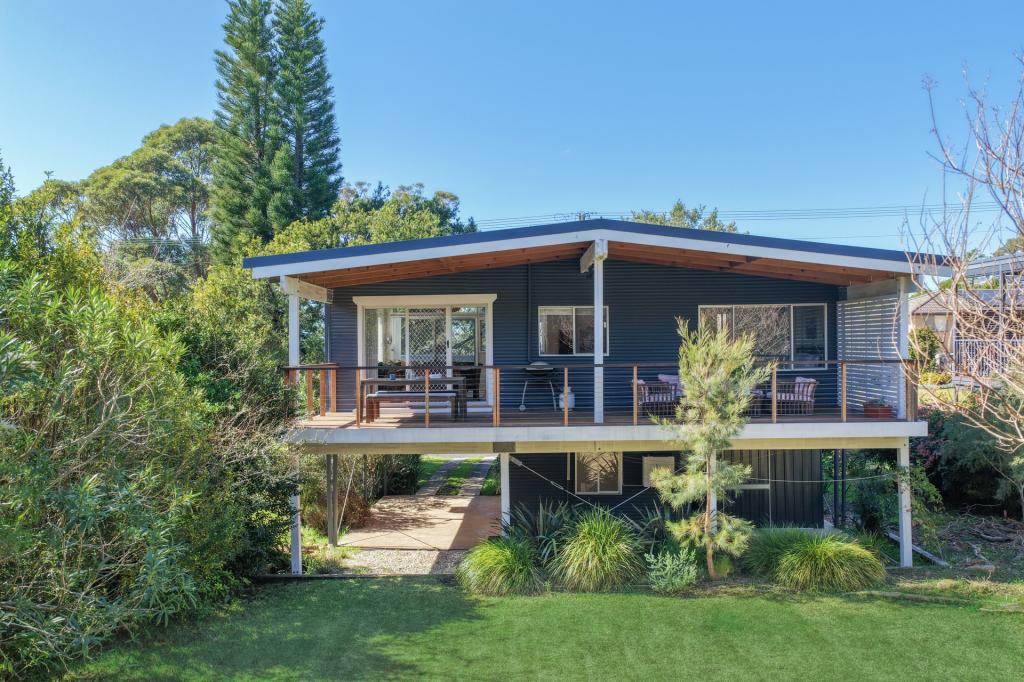 0
0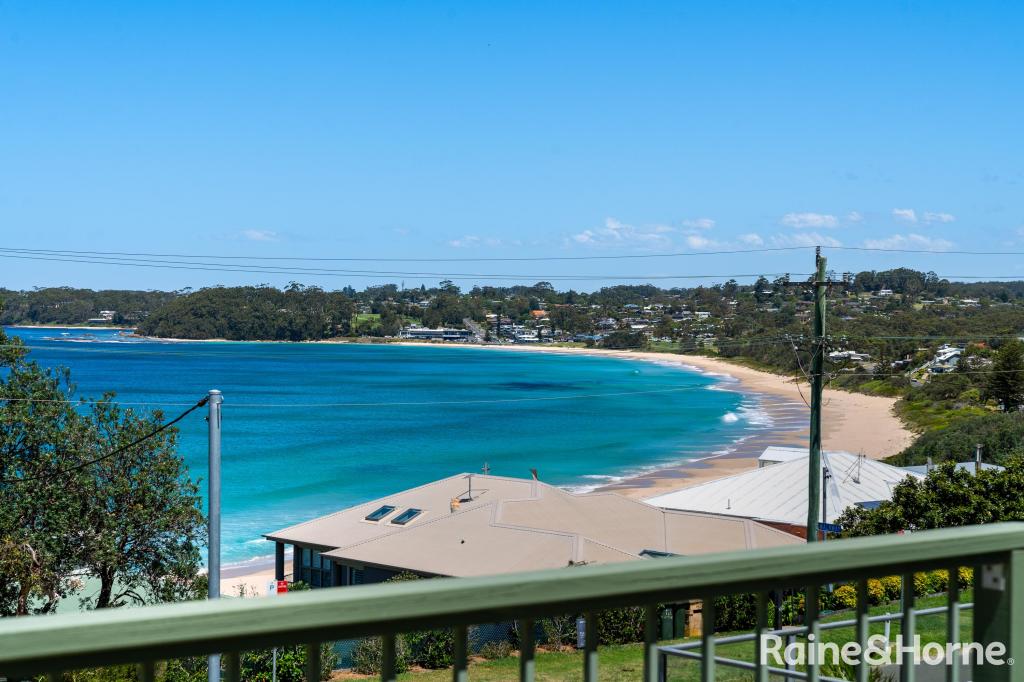 0
0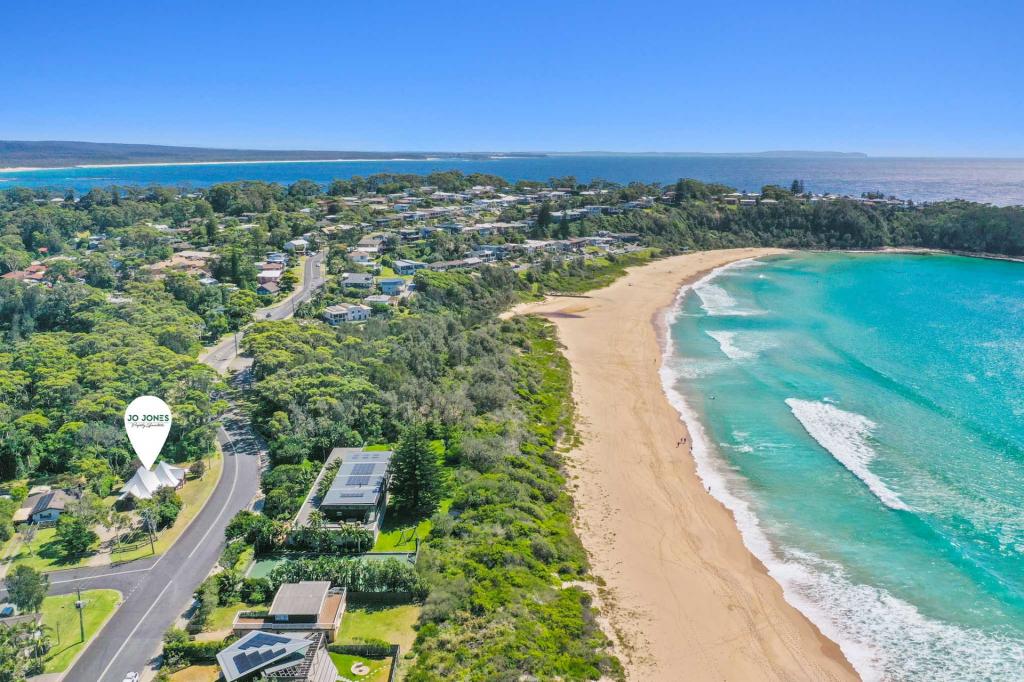 0
0Similar properties For Rent nearby
See more properties for rent nearby 0
0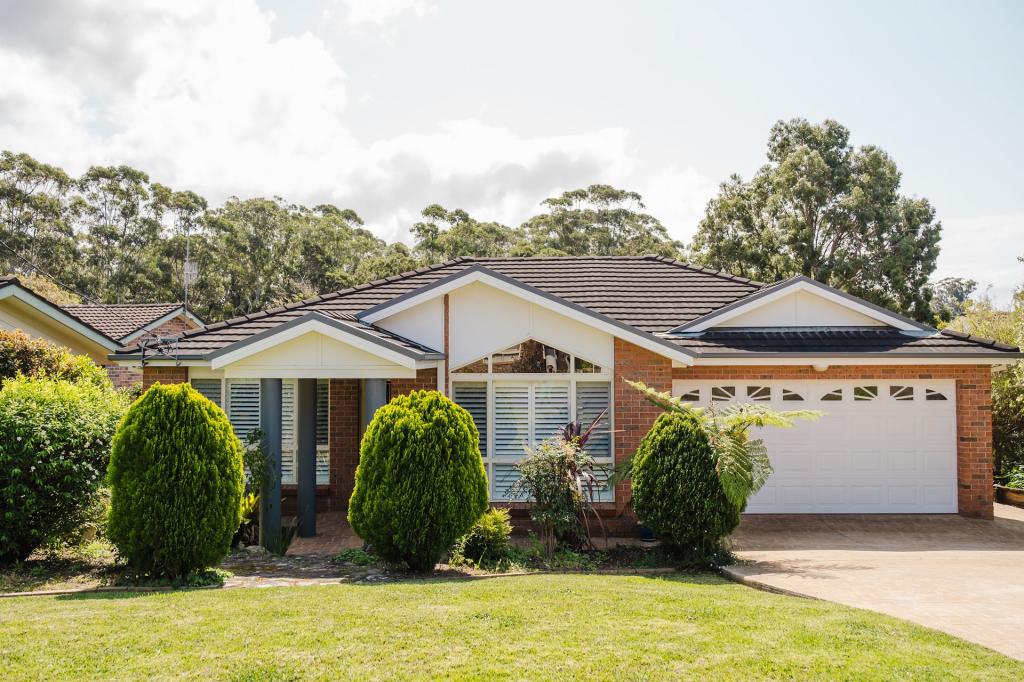 0
0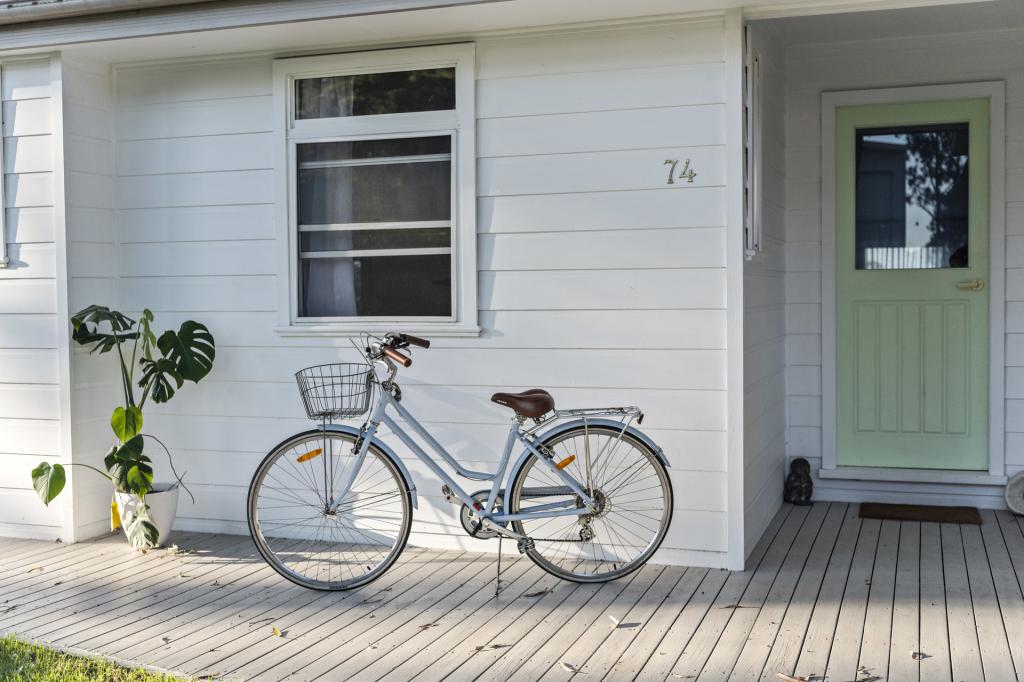 0
0About Mollymook Beach 2539
The size of Mollymook Beach is approximately 3.3 square kilometres. There are 12 parks, covering nearly 34.3% of the total area. The population of Mollymook Beach in 2016 was 2447 people. By 2021 the population was 2531 showing a population growth of 3.4% in the area during that time. The predominant age group in Mollymook Beach is 60-69 years. Households in Mollymook Beach are primarily childless couples and are likely to be repaying $1800 - $2399 per month on mortgage repayments. In general, people in Mollymook Beach work in a professional occupation.In 2021, 80.20% of the homes in Mollymook Beach were owner-occupied compared with 77.30% in 2016.
Mollymook Beach has 2,013 properties. Over the last 5 years, Houses in Mollymook Beach have seen a 33.02% increase in median value, while Units have seen a 28.49% increase. As at 30 June 2026:
- The median value for Houses in Mollymook Beach is $1,115,877 while the median value for Units is $779,060.
- Houses have a median rent of $650 while Units have a median rent of $530.
Suburb Insights for Mollymook Beach 2539
Market Insights
Mollymook Beach Trends for Houses
N/A
N/A
View TrendN/A
N/A
Mollymook Beach Trends for Units
N/A
N/A
View TrendN/A
N/A
Neighbourhood Insights
© Copyright 2026. RP Data Pty Ltd trading as Cotality (Cotality). All rights reserved. No reproduction, distribution, or transmission of the copyrighted materials is permitted. The information is deemed reliable but not guaranteed.
While Cotality uses commercially reasonable efforts to ensure the Cotality Data is current, Cotality does not warrant the accuracy, currency or completeness of the Cotality Data and to the full extent permitted by law excludes all loss or damage howsoever arising (including through negligence) in connection with the Cotality Data.
This product uses cookies and other similar technologies to improve and customise your browsing experience, to tailor content and adverts, and for analytics and metrics regarding visitor usage on this product and other media. We may share cookie and analytics information with third parties for the purposes of advertising. By continuing to use our website, you consent to cookies being used. View our Privacy Policy here.
X