
43 Boag StreetMollymook NSW 2539
Property Details for 43 Boag St, Mollymook
43 Boag St, Mollymook is a 4 bedroom, 2 bathroom House with 1 parking spaces and was built in 1975. The property has a land size of 876m2 and floor size of 156m2. While the property is not currently for sale or for rent, it was last sold in July 2007.
Last Listing description (July 2007)
Now's The Time!
Time to enter the ever popular Mollymook real estate market - This well located double storey 4 bedroom home is situated just outside the golden triangle & only minutes walk to beautiful Mollymook Beach. Take in the ocean views from the upper level living areas. This property offers huge potential with a large workable 889sqm level block & a location that will only increase in value.
Property History for 43 Boag St, Mollymook, NSW 2539
- 02 Mar 2013Listed for Rent - Price not available
- 16 Jul 2007Sold for $470,000
- 25 Apr 2007Listed for Sale Not Disclosed

Recent sales nearby
See more recent sales nearbySimilar properties For Sale nearby
See more properties for sale nearby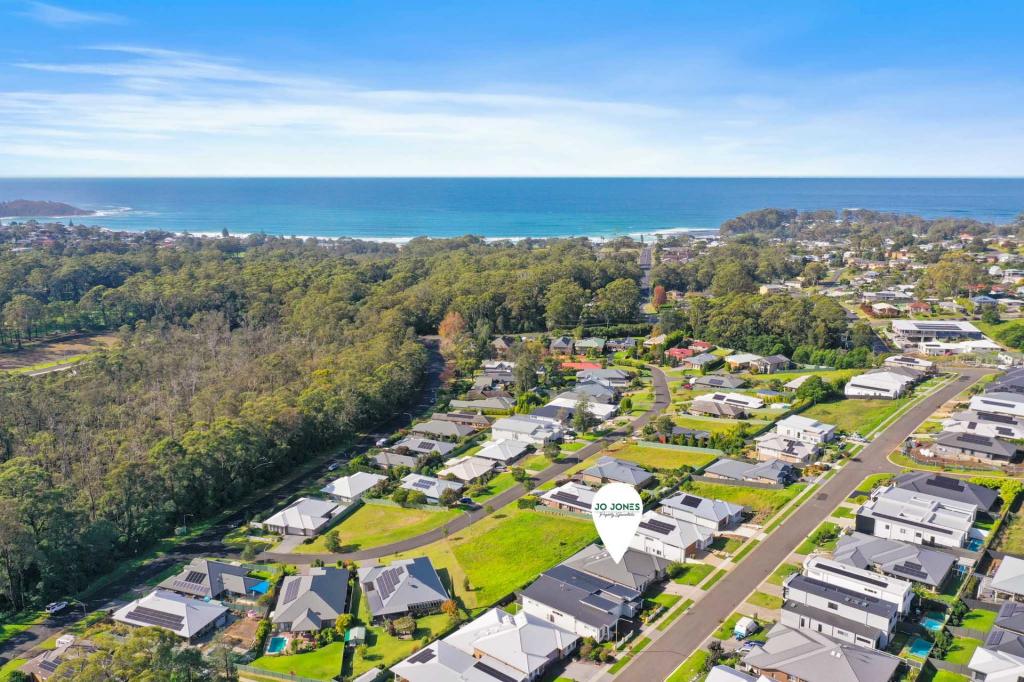 0
0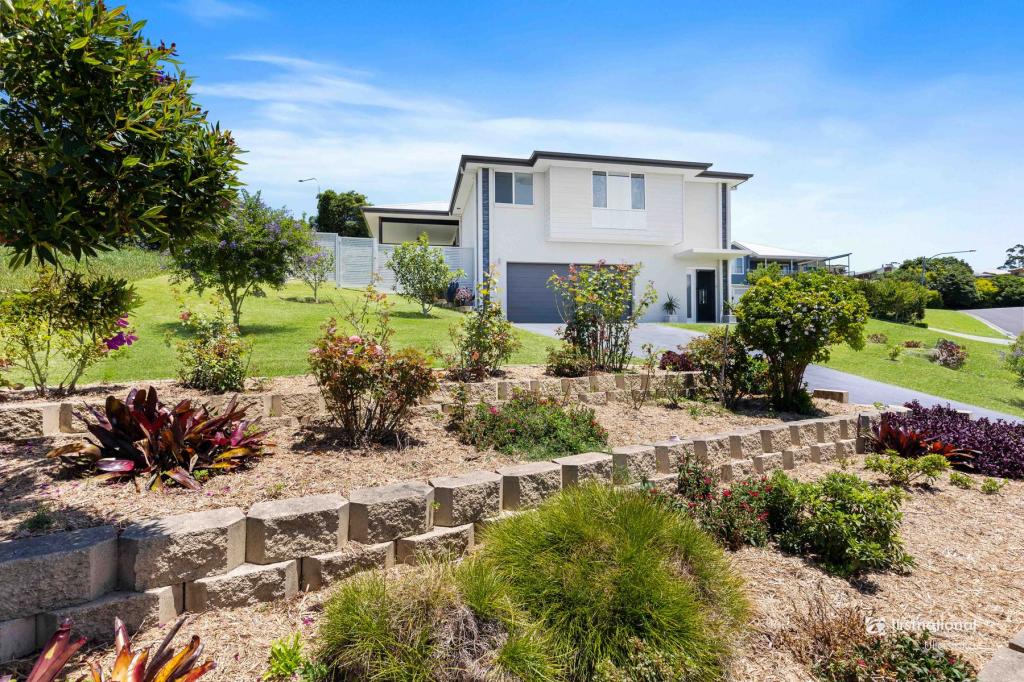 0
0 0
0Similar properties For Rent nearby
See more properties for rent nearby 0
0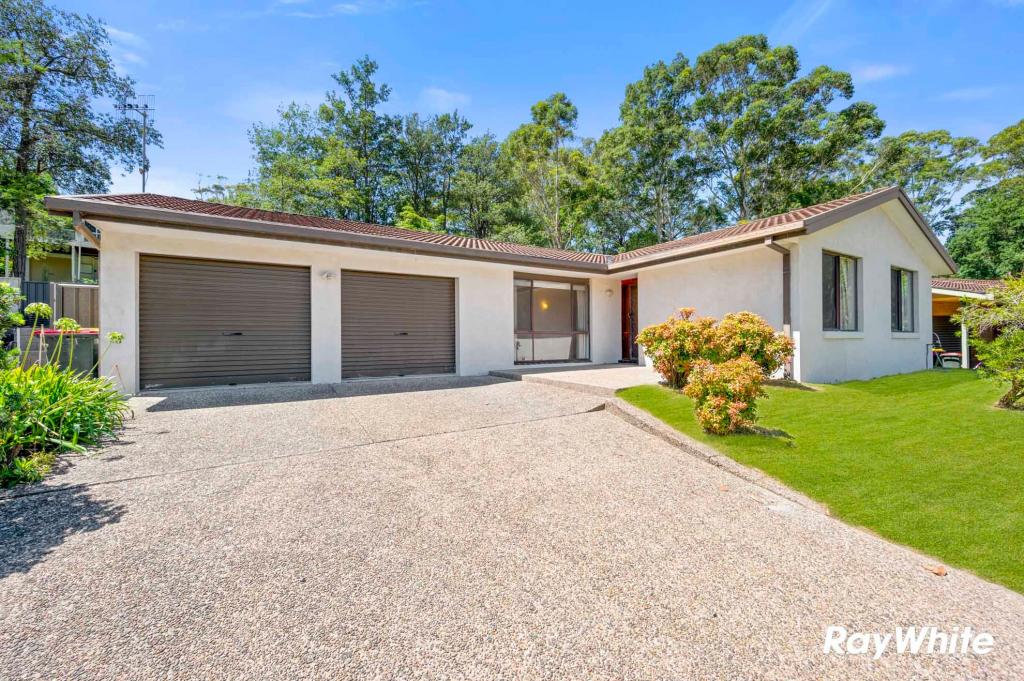 0
0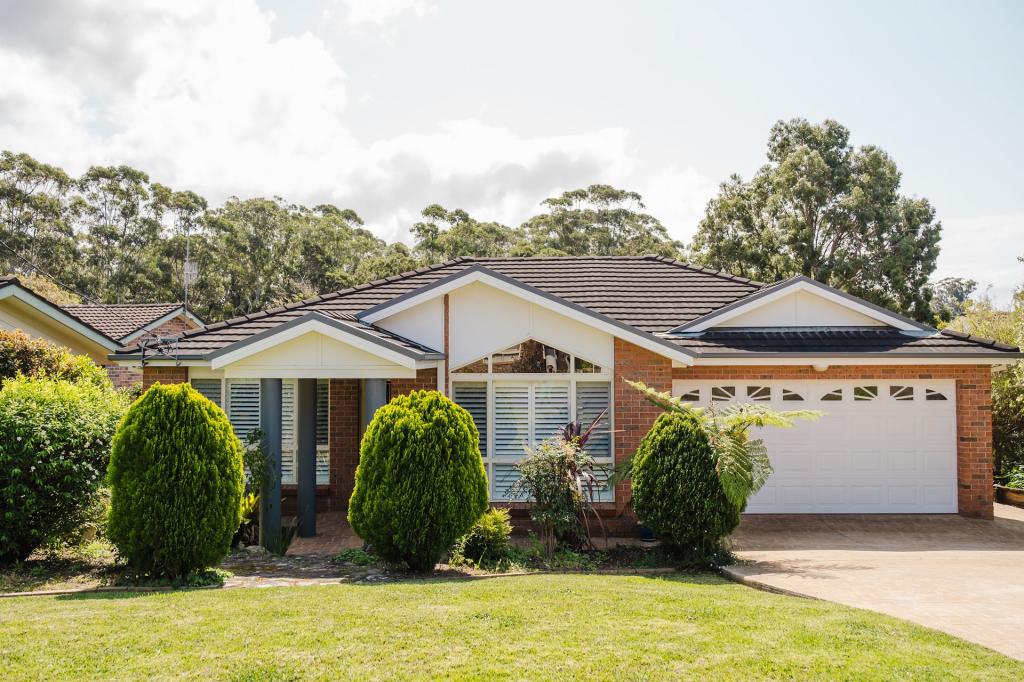 0
0About Mollymook 2539
The size of Mollymook is approximately 1.8 square kilometres. There are 8 parks, covering nearly 25.4% of the total area. The population of Mollymook in 2016 was 1083 people. By 2021 the population was 1195 showing a population growth of 10.3% in the area during that time. The predominant age group in Mollymook is 60-69 years. Households in Mollymook are primarily childless couples and are likely to be repaying $1800 - $2399 per month on mortgage repayments. In general, people in Mollymook work in a professional occupation.In 2021, 75.10% of the homes in Mollymook were owner-occupied compared with 73.90% in 2016.
Mollymook has 1,252 properties. Over the last 5 years, Houses in Mollymook have seen a 36.34% increase in median value, while Units have seen a 28.72% increase. As at 31 May 2026:
- The median value for Houses in Mollymook is $1,127,702 while the median value for Units is $686,347.
- Houses have a median rent of $610 while Units have a median rent of $498.
Suburb Insights for Mollymook 2539
Market Insights
Mollymook Trends for Houses
N/A
N/A
View TrendN/A
N/A
Mollymook Trends for Units
N/A
N/A
View TrendN/A
N/A
Neighbourhood Insights
© Copyright 2026. RP Data Pty Ltd trading as Cotality (Cotality). All rights reserved. No reproduction, distribution, or transmission of the copyrighted materials is permitted. The information is deemed reliable but not guaranteed.
While Cotality uses commercially reasonable efforts to ensure the Cotality Data is current, Cotality does not warrant the accuracy, currency or completeness of the Cotality Data and to the full extent permitted by law excludes all loss or damage howsoever arising (including through negligence) in connection with the Cotality Data.
This product uses cookies and other similar technologies to improve and customise your browsing experience, to tailor content and adverts, and for analytics and metrics regarding visitor usage on this product and other media. We may share cookie and analytics information with third parties for the purposes of advertising. By continuing to use our website, you consent to cookies being used. View our Privacy Policy here.
X