
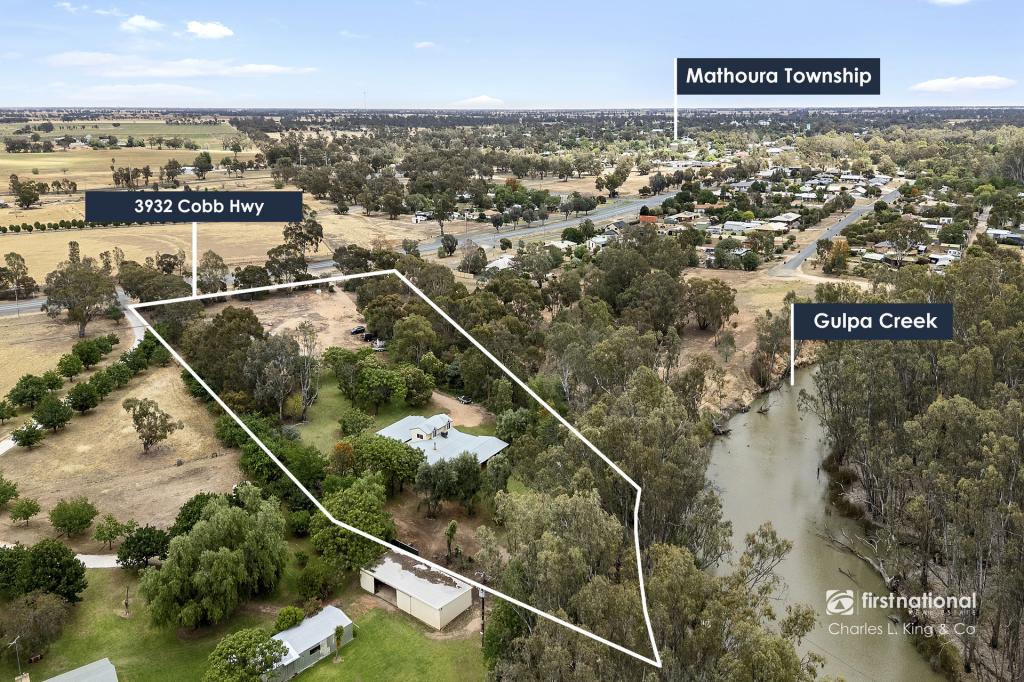
3/38 Mathoura StreetMathoura NSW 2710
Property Details for 3/38 Mathoura St, Mathoura
3/38 Mathoura St, Mathoura is a 2 bedroom, 1 bathroom Unit with 1 parking spaces and was built in 1985. The property has a land size of 2024m2 and floor size of 86m2. While the property is not currently for sale or for rent, it was last sold in July 2022.
Last Listing description (October 2018)
Neat two bedroom unit located in central Mathoura. The spacious open living dining area is accompanied by a large kitchen with ample storage. Both bedrooms are larger in size and offer built in robes. The unit comprising of a small courtyard without need for maintenance as well as two storage units being a lockup under carport and garden shed at rear. Enquire today as vacant properties in the area aren't common!
Property History for 3/38 Mathoura St, Mathoura, NSW 2710
- 07 Jul 2022Sold for $118,500
- 07 Sep 2018Listed for Rent $170 / week
- 23 Jun 2014Listed for Rent $140 / week

Recent sales nearby
See more recent sales nearbySimilar properties For Sale nearby
See more properties for sale nearby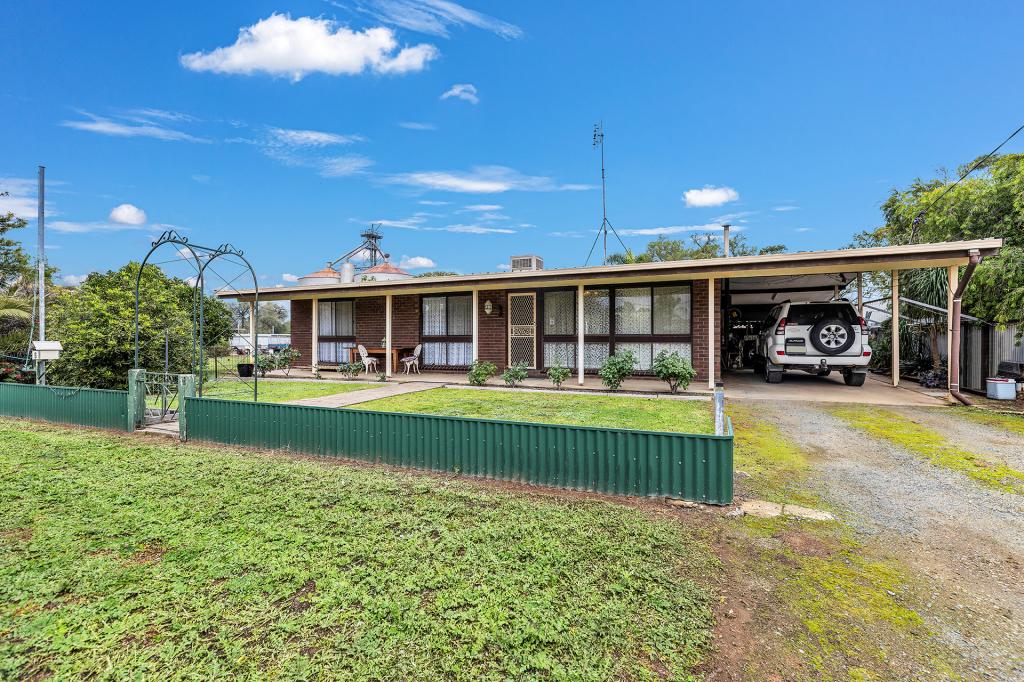 0
0
 0
0 0
0About Mathoura 2710
The size of Mathoura is approximately 546.2 square kilometres. There are 8 parks, covering nearly 50.6% of the total area. The population of Mathoura in 2016 was 938 people. By 2021 the population was 1002 showing a population growth of 6.8% in the area during that time. The predominant age group in Mathoura is 60-69 years. Households in Mathoura are primarily childless couples and are likely to be repaying $1000 - $1399 per month on mortgage repayments. In general, people in Mathoura work in a managers occupation.In 2021, 78.30% of the homes in Mathoura were owner-occupied compared with 76.40% in 2016.
Mathoura has 700 properties. Over the last 5 years, Houses in Mathoura have seen a 45.96% increase in median value, while Units have seen a 64.00% increase. As at 30 June 2026:
- The median value for Houses in Mathoura is $340,897 while the median value for Units is $324,185.
Suburb Insights for Mathoura 2710
Market Insights
Mathoura Trends for Houses
N/A
N/A
View TrendN/A
N/A
Mathoura Trends for Units
N/A
N/A
View TrendN/A
N/A
Neighbourhood Insights
© Copyright 2026. RP Data Pty Ltd trading as Cotality (Cotality). All rights reserved. No reproduction, distribution, or transmission of the copyrighted materials is permitted. The information is deemed reliable but not guaranteed.
While Cotality uses commercially reasonable efforts to ensure the Cotality Data is current, Cotality does not warrant the accuracy, currency or completeness of the Cotality Data and to the full extent permitted by law excludes all loss or damage howsoever arising (including through negligence) in connection with the Cotality Data.
This product uses cookies and other similar technologies to improve and customise your browsing experience, to tailor content and adverts, and for analytics and metrics regarding visitor usage on this product and other media. We may share cookie and analytics information with third parties for the purposes of advertising. By continuing to use our website, you consent to cookies being used. View our Privacy Policy here.
X