
99 Kelman Street ELower Belford NSW 2335
Property Details for 99 Kelman St E, Lower Belford
Last Listing description (November 2015)
Ideal for the horse enthusiast..with great riding trails in the nearby state forest and close proximity to Belford Equine Centre....
* 6.5 park like acres with 2 dams and fully fenced into 4 paddocks with stock shelters
* The homestead comprises 4 double bedrooms plus study/5th, ensuite to main and robes to all rooms
* 4 separate living options, ducted reverse cycle air throughout plus fireplace
* Self contained teenagers retreat with separate bedroom and bathroom
* Double garage with carport+separate carport for caravan or float
* Above ground pool and verandahs that run the full length of the home completes this perfectly located property
Property History for 99 Kelman St E, Lower Belford, NSW 2335
- 13 Oct 2015Sold for $720,000
- 26 Aug 2015Listed for Sale $735,000
- 17 Oct 2013Listed for Rent - Price not available
Recent sales nearby
See more recent sales nearby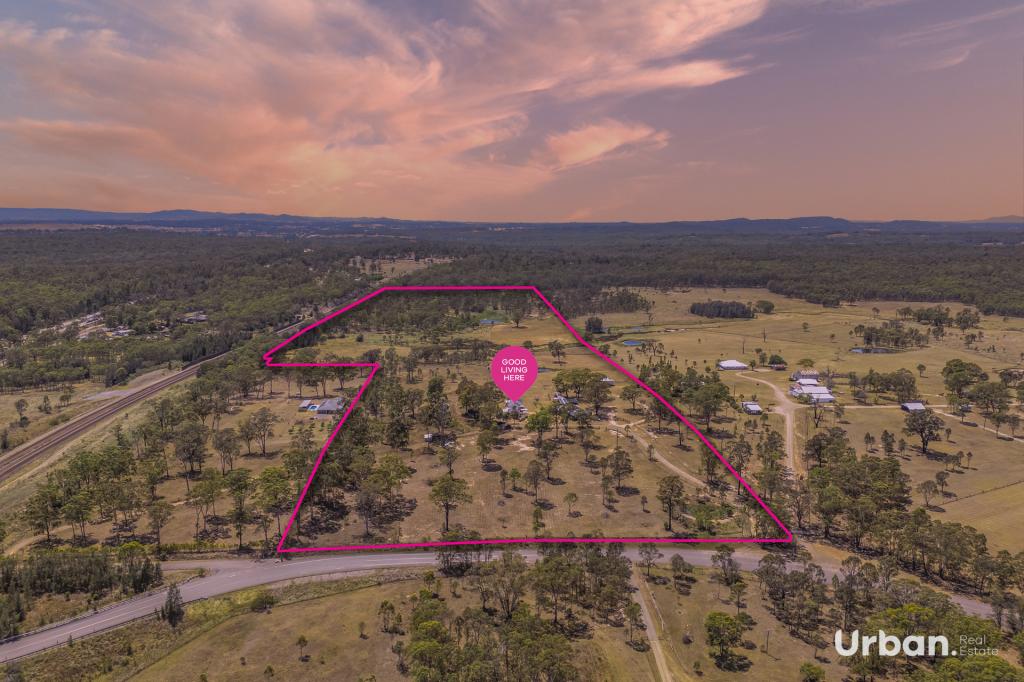 0
0About Lower Belford 2335
The size of Lower Belford is approximately 41.8 square kilometres. There is 1 park within the area. The population of Lower Belford in 2016 was 392 people. By 2021 the population was 407 showing a population growth of 3.8% in the area during that time. The predominant age group in Lower Belford is 50-59 years. Households in Lower Belford are primarily couples with children and are likely to be repaying $3000 - $3999 per month on mortgage repayments. In general, people in Lower Belford work in a managers occupation.In 2021, 86.00% of the homes in Lower Belford were owner-occupied compared with 85.00% in 2016.
Lower Belford has 203 properties. Over the last 5 years, Houses in Lower Belford have seen a 46.85% increase in median value, while Units have seen a 16.74% increase. As at 31 May 2026:
- The median value for Houses in Lower Belford is $1,583,291 while the median value for Units is $423,682.
Suburb Insights for Lower Belford 2335
Market Insights
Lower Belford Trends for Houses
N/A
N/A
View TrendN/A
N/A
Lower Belford Trends for Units
N/A
N/A
View TrendN/A
N/A
Neighbourhood Insights
© Copyright 2026. RP Data Pty Ltd trading as Cotality (Cotality). All rights reserved. No reproduction, distribution, or transmission of the copyrighted materials is permitted. The information is deemed reliable but not guaranteed.
While Cotality uses commercially reasonable efforts to ensure the Cotality Data is current, Cotality does not warrant the accuracy, currency or completeness of the Cotality Data and to the full extent permitted by law excludes all loss or damage howsoever arising (including through negligence) in connection with the Cotality Data.
This product uses cookies and other similar technologies to improve and customise your browsing experience, to tailor content and adverts, and for analytics and metrics regarding visitor usage on this product and other media. We may share cookie and analytics information with third parties for the purposes of advertising. By continuing to use our website, you consent to cookies being used. View our Privacy Policy here.
X