9 Busby RoadLower Belford NSW 2335
Property Details for 9 Busby Rd, Lower Belford
Last Listing description (December 2014)
STUNNING & UNIQUE
Offering a luxury lifestyle that you usually only dream about.
Surrounded by beautiful, rural, mountain views on 9 acres.
A warm ambiance, surrounds you as you step through onto polished timber floors & open plan living areas.
French doors open from a variety of rooms onto a wide verandah
High decorative ceilings, ducted A/C, ceiling fans, luxury bathrooms / ensuites, & a wine cellar, are just a few of the features.
The gorgeous & practical country style kitchen has Miele appliances with gas cooking, flowing through to the dining
& alfresco areas.
There are 4 roomy bedrooms with french doors opening to the verandah & 2 have ensuites.
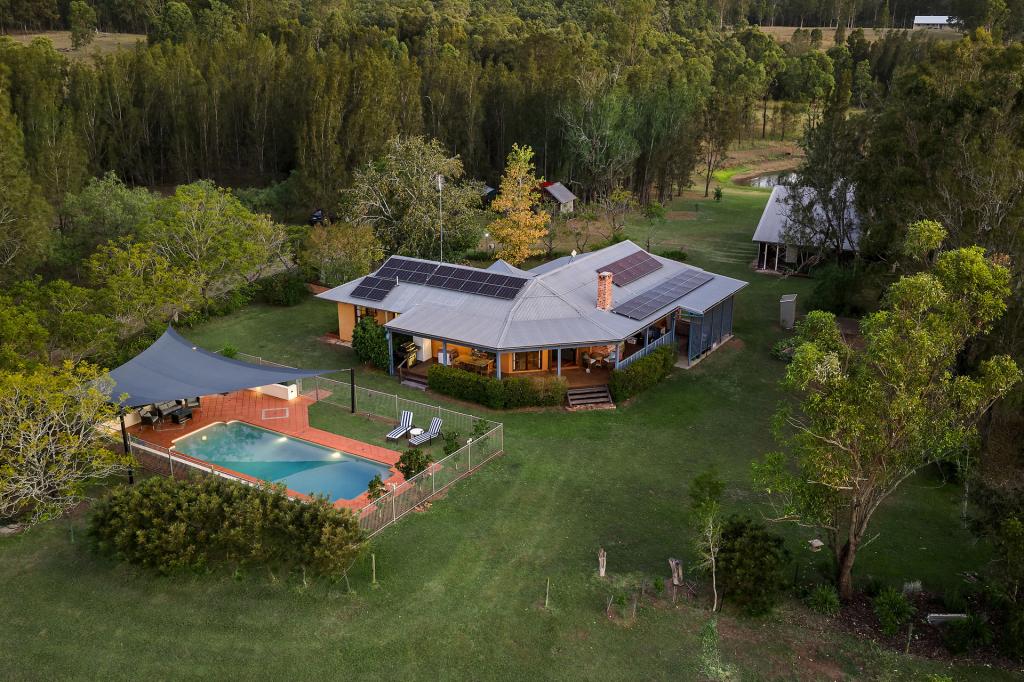
An enclosed entertaining area sits at the rear of the home with a bar, fireplace & views over a 12m inground pool, spa & beyond.
Externally near the pool, you have 2 bathrooms for entertaining guests.
The house yard is securely fenced for dogs & children.
The land is good quality soil, Kikuyu grass, ideal for grazing livestock, with quality infrastructure.
Large sheds, all with power,
4 brick stables with tack room.
Post & rail yards & well fenced paddocks all with auto water supply
Fruit orchard
Large Dam
Water license from the river with underground pumping line to the property.
School Bus is at the front gate & only 10 min from Singleton or Branxton.
Located at the end of the Hunter Expressway, makes this property easily accessible to Newcastle (approx. 35 min)
Maitland (20 min).
Property History for 9 Busby Rd, Lower Belford, NSW 2335
- 03 Dec 2014Sold for $870,000
- 10 Sep 2014Listed for Sale Offers Above $899,000
- 22 Dec 2006Sold for $783,000
Recent sales nearby
See more recent sales nearby

 0
0About Lower Belford 2335
The size of Lower Belford is approximately 41.8 square kilometres. There is 1 park within the area. The population of Lower Belford in 2016 was 392 people. By 2021 the population was 407 showing a population growth of 3.8% in the area during that time. The predominant age group in Lower Belford is 50-59 years. Households in Lower Belford are primarily couples with children and are likely to be repaying $3000 - $3999 per month on mortgage repayments. In general, people in Lower Belford work in a managers occupation.In 2021, 86.00% of the homes in Lower Belford were owner-occupied compared with 85.00% in 2016.
Lower Belford has 205 properties. Over the last 5 years, Houses in Lower Belford have seen a 27.78% increase in median value, while Units have seen a 16.74% increase. As at 31 August 2026:
- The median value for Houses in Lower Belford is $1,497,458 while the median value for Units is $423,682.
Suburb Insights for Lower Belford 2335
Market Insights
Lower Belford Trends for Houses
N/A
N/A
View TrendN/A
N/A
Lower Belford Trends for Units
N/A
N/A
View TrendN/A
N/A
Neighbourhood Insights
© Copyright 2026. RP Data Pty Ltd trading as Cotality (Cotality). All rights reserved. No reproduction, distribution, or transmission of the copyrighted materials is permitted. The information is deemed reliable but not guaranteed.
While Cotality uses commercially reasonable efforts to ensure the Cotality Data is current, Cotality does not warrant the accuracy, currency or completeness of the Cotality Data and to the full extent permitted by law excludes all loss or damage howsoever arising (including through negligence) in connection with the Cotality Data.
This product uses cookies and other similar technologies to improve and customise your browsing experience, to tailor content and adverts, and for analytics and metrics regarding visitor usage on this product and other media. We may share cookie and analytics information with third parties for the purposes of advertising. By continuing to use our website, you consent to cookies being used. View our Privacy Policy here.
X