
8 Manning StreetKiama NSW 2533
Property Details for 8 Manning St, Kiama
8 Manning St, Kiama is a 2 bedroom, 1 bathroom House with 1 parking spaces. The property has a land size of 176m2 and floor size of 170m2. While the property is not currently for sale or for rent, it was last sold in October 2015.
Last Listing description (July 2016)
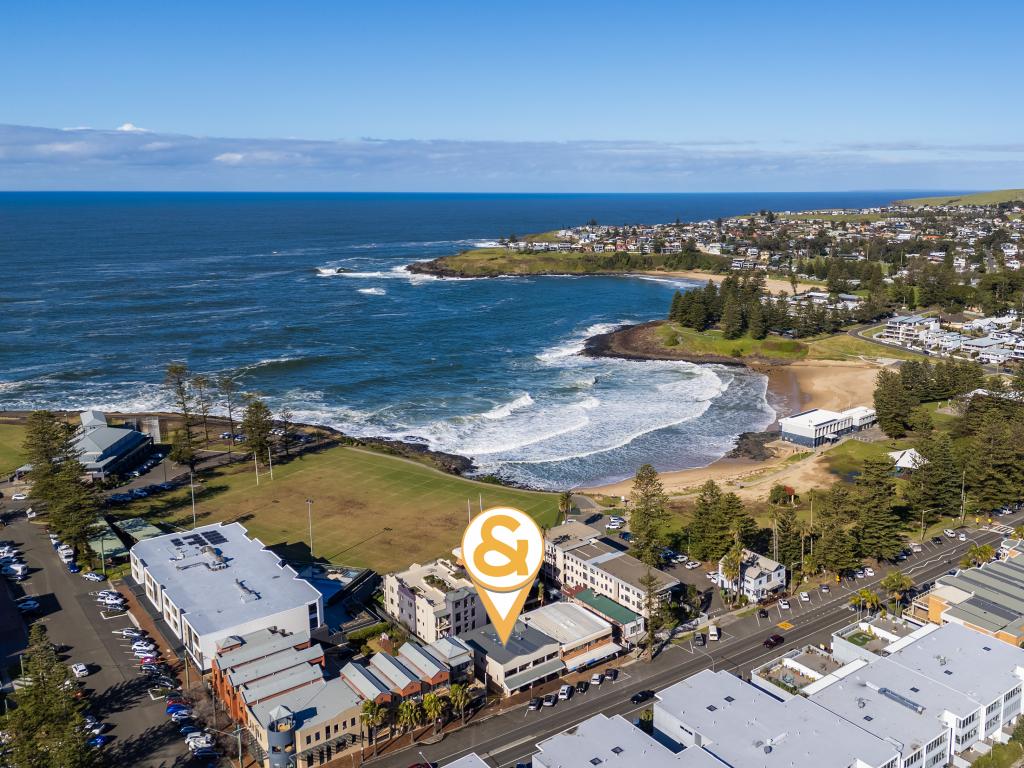
PERFECTLY POSITIONED IN THE CENTRE OF KIAMA'S BEAUTIFUL TOWNSHIP EXISTS AN OPPORTUNITY TO SECURE THIS SOUGHT AFTER COMMERCIAL OFFICE SPACE. WITH WATER VIEWS AND KIAMA HARBOUR LESS THAN 50 METRES FROM THE FRONT DOOR. THE OFFICE IS LOCATED ABOVE THE STONEWALL CAFE WHICH IS THE ONLY ONE IN KIAMA WITH COURTYARD ACCESS.THE OFFICE UPSTAIRS IS A 3 BEDROOM UNIT WITH FULL BATHROOM AND KITCHEN. THE LOCATION ENJOYS A HIGH LEVEL OF BOTH VEHICLE AND PEDESTRIAN TRAFFIC.
Property History for 8 Manning St, Kiama, NSW 2533
- 29 Jul 2016Listed for Rent $31,200 / year
- 06 Oct 2015Sold for $1,225,000
- 02 Sep 2015Listed for Sale Auction

Recent sales nearby
See more recent sales nearby
Similar properties For Sale nearby
See more properties for sale nearby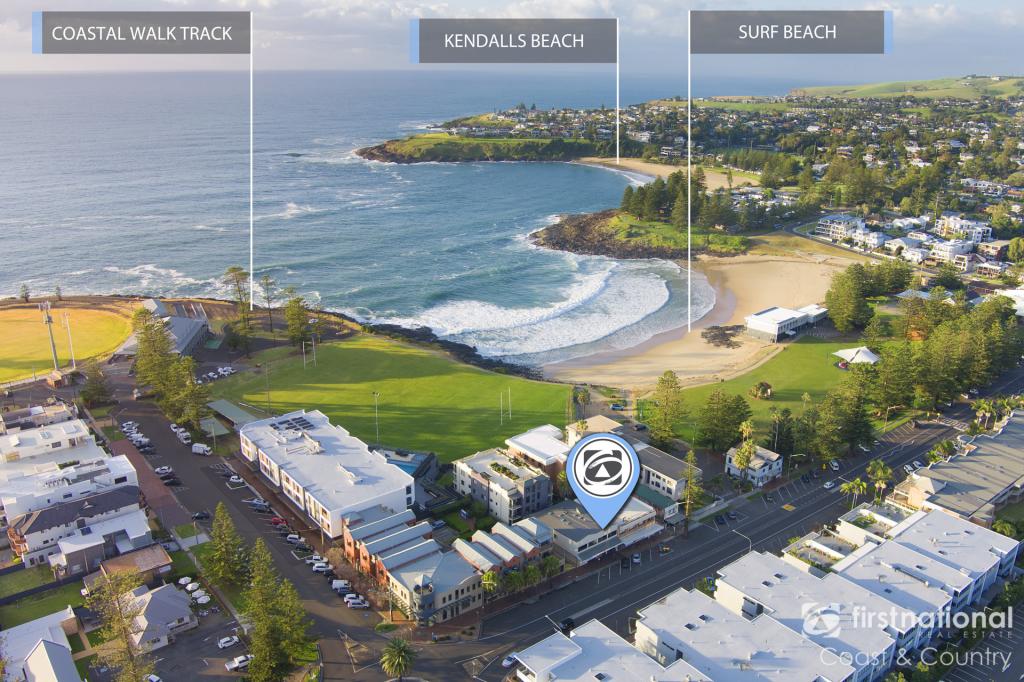 0
0
 0
0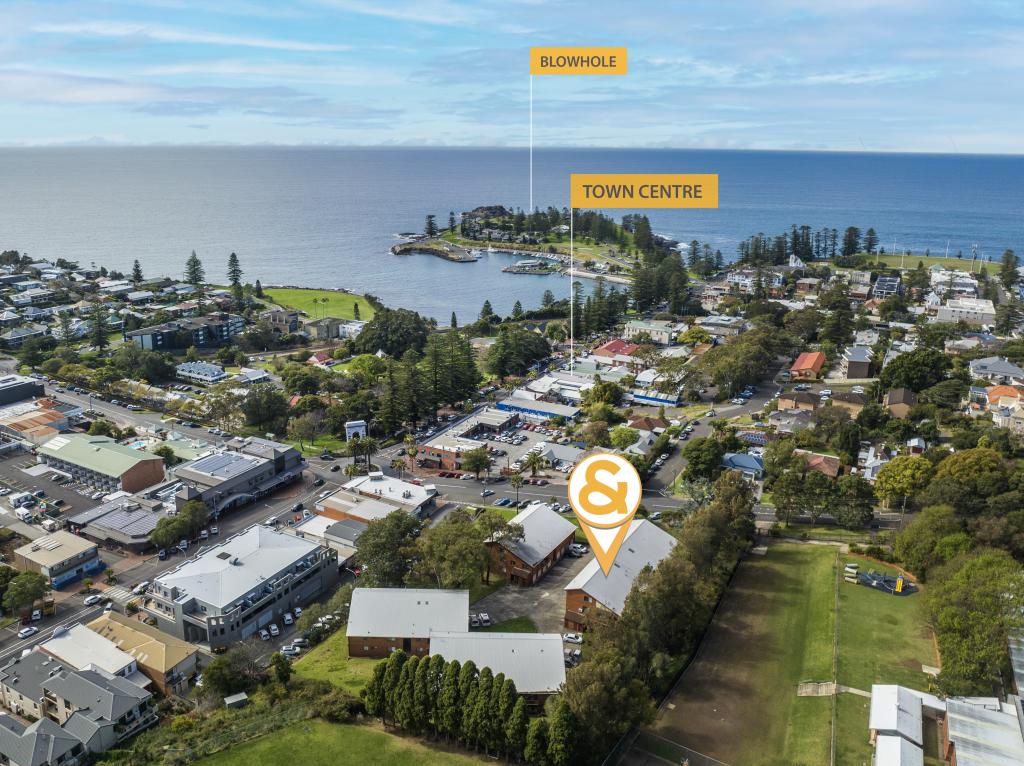 0
0
Similar properties For Rent nearby
See more properties for rent nearby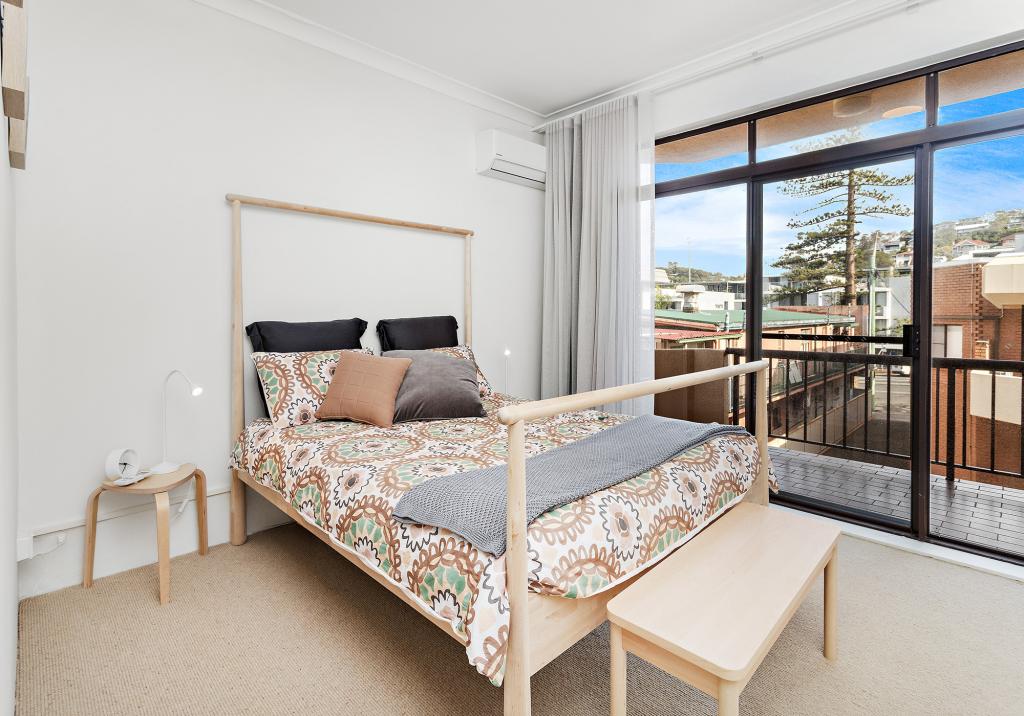 0
0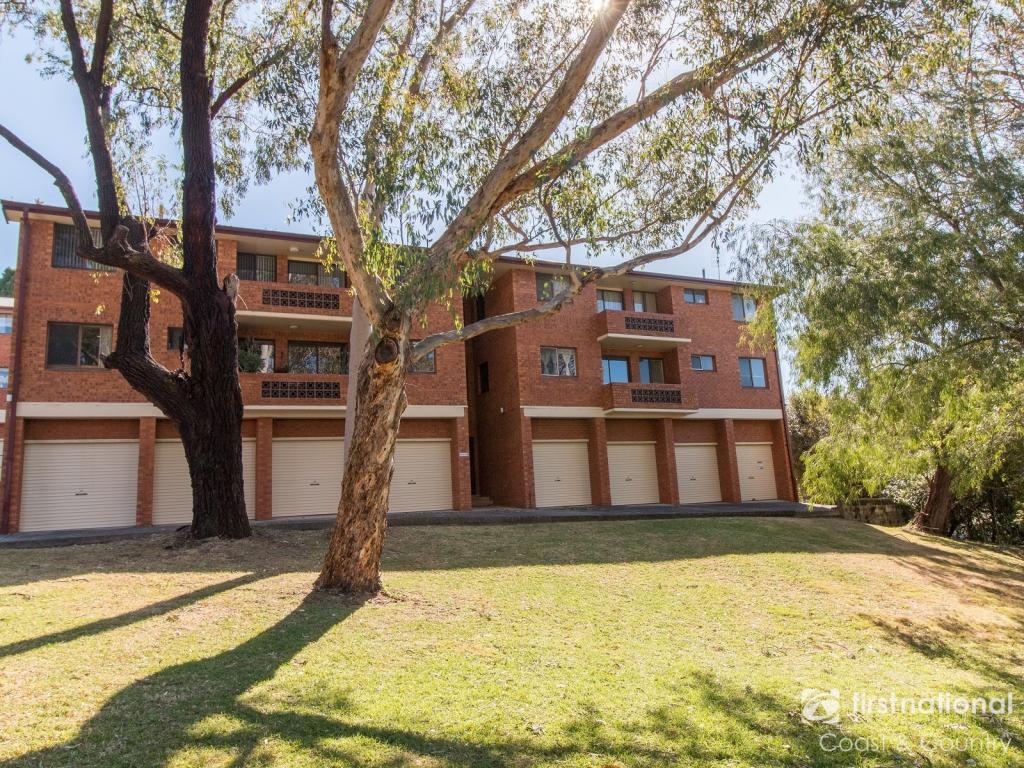 0
0
 0
0About Kiama 2533
The size of Kiama is approximately 10.0 square kilometres. There are 27 parks, covering nearly 7.6% of the total area. The population of Kiama in 2016 was 6881 people. By 2021 the population was 7904 showing a population growth of 14.9% in the area during that time. The predominant age group in Kiama is 60-69 years. Households in Kiama are primarily childless couples and are likely to be repaying $1800 - $2399 per month on mortgage repayments. In general, people in Kiama work in a professional occupation.In 2021, 71.00% of the homes in Kiama were owner-occupied compared with 71.20% in 2016.
Kiama has 5,167 properties. Over the last 5 years, Houses in Kiama have seen a 13.36% increase in median value, while Units have seen a 17.87% increase. As at 31 May 2026:
- The median value for Houses in Kiama is $1,541,804 while the median value for Units is $940,205.
- Houses have a median rent of $800 while Units have a median rent of $655.
Suburb Insights for Kiama 2533
Market Insights
Kiama Trends for Houses
N/A
N/A
View TrendN/A
N/A
Kiama Trends for Units
N/A
N/A
View TrendN/A
N/A
Neighbourhood Insights
© Copyright 2026. RP Data Pty Ltd trading as Cotality (Cotality). All rights reserved. No reproduction, distribution, or transmission of the copyrighted materials is permitted. The information is deemed reliable but not guaranteed.
While Cotality uses commercially reasonable efforts to ensure the Cotality Data is current, Cotality does not warrant the accuracy, currency or completeness of the Cotality Data and to the full extent permitted by law excludes all loss or damage howsoever arising (including through negligence) in connection with the Cotality Data.
This product uses cookies and other similar technologies to improve and customise your browsing experience, to tailor content and adverts, and for analytics and metrics regarding visitor usage on this product and other media. We may share cookie and analytics information with third parties for the purposes of advertising. By continuing to use our website, you consent to cookies being used. View our Privacy Policy here.
X