
9/21 Lagonda DriveIngleburn NSW 2565
Property Details for 9/21 Lagonda Dr, Ingleburn
9/21 Lagonda Dr, Ingleburn is a 3 bedroom, 1 bathroom Unit with 1 parking spaces and was built in 1985. The property has a land size of 6236m2 and floor size of 94m2. While the property is not currently for sale or for rent, it was last sold in March 2009.
Last Listing description (April 2009)
PRETTY AS A PICTURE
* CLOSE TO SHOPS * CLOSE TO TRANSPORT
* PERGOLA * AIR CONDITIONING
JUST MOVE IN AND ENJOY THE PLEASANT DE-CORE THIS VILLA PRESENTS. OFFERING 3 BEDROOMS WITH BUILT-INS TO ALL, L-SHAPED LOUNGE & DINING, SPACIOUS KITCHEN, REVERSE CYCLE AIR CONDITIONING, LOCK-UP GARAGE, CLOSE TO LOCAL SHOPS, TRANSPORT & DAYCARE. CALL DON ON 0421 702 659 OR 9829 1899 FOR AN INSPECTION TODAY.
ADDITIONAL FEATURE - 159 SQM; FLAT CONTOUR; SOUTH ASPECT; FULLY FENCED; URBAN VIEWS; PUBLIC TRANSPORT: CLOSE BY; BBQ.
Property History for 9/21 Lagonda Dr, Ingleburn, NSW 2565
- 12 Apr 2019Sold
- 30 Mar 2009Sold for $242,000
- 26 Mar 2009Listed for Sale $249,000

Recent sales nearby
See more recent sales nearby
Similar properties For Sale nearby
See more properties for sale nearby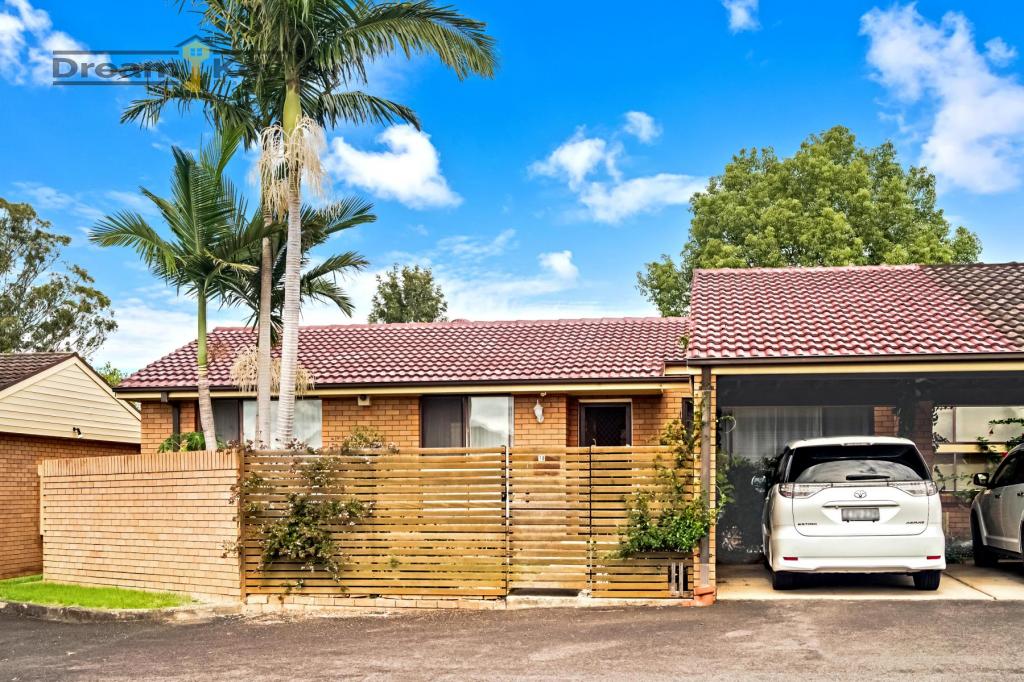 0
0 0
0 0
0Similar properties For Rent nearby
See more properties for rent nearby 0
0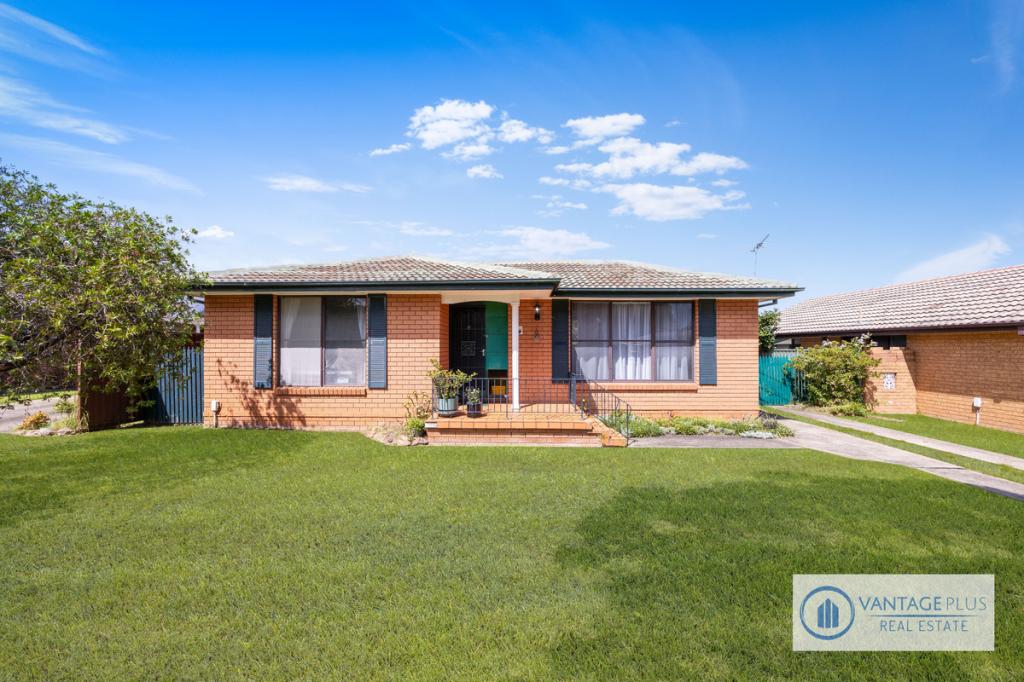 0
0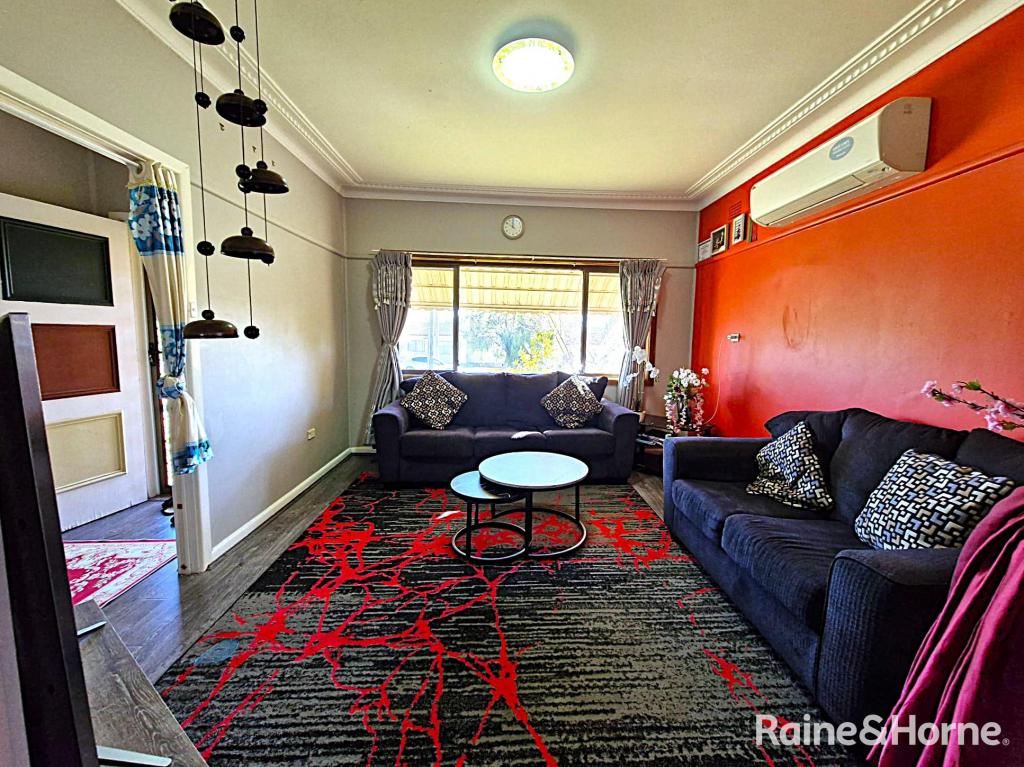 0
0About Ingleburn 2565
The size of Ingleburn is approximately 12.3 square kilometres. There are 23 parks, covering nearly 4.7% of the total area. The population of Ingleburn in 2016 was 15039 people. By 2021 the population was 15264 showing a population growth of 1.5% in the area during that time. The predominant age group in Ingleburn is 30-39 years. Households in Ingleburn are primarily couples with children and are likely to be repaying $1800 - $2399 per month on mortgage repayments. In general, people in Ingleburn work in a professional occupation.In 2021, 63.80% of the homes in Ingleburn were owner-occupied compared with 65.10% in 2016.
Ingleburn has 7,883 properties. Over the last 5 years, Houses in Ingleburn have seen a 45.42% increase in median value, while Units have seen a 49.17% increase. As at 31 May 2026:
- The median value for Houses in Ingleburn is $1,099,988 while the median value for Units is $706,945.
- Houses have a median rent of $650 while Units have a median rent of $560.
Suburb Insights for Ingleburn 2565
Market Insights
Ingleburn Trends for Houses
N/A
N/A
View TrendN/A
N/A
Ingleburn Trends for Units
N/A
N/A
View TrendN/A
N/A
Neighbourhood Insights
© Copyright 2026. RP Data Pty Ltd trading as Cotality (Cotality). All rights reserved. No reproduction, distribution, or transmission of the copyrighted materials is permitted. The information is deemed reliable but not guaranteed.
While Cotality uses commercially reasonable efforts to ensure the Cotality Data is current, Cotality does not warrant the accuracy, currency or completeness of the Cotality Data and to the full extent permitted by law excludes all loss or damage howsoever arising (including through negligence) in connection with the Cotality Data.
This product uses cookies and other similar technologies to improve and customise your browsing experience, to tailor content and adverts, and for analytics and metrics regarding visitor usage on this product and other media. We may share cookie and analytics information with third parties for the purposes of advertising. By continuing to use our website, you consent to cookies being used. View our Privacy Policy here.
X