
4 Belford StreetIngleburn NSW 2565
Property Details for 4 Belford St, Ingleburn
4 Belford St, Ingleburn is a 6 bedroom, 4 bathroom House with 2 parking spaces and was built in 2021. The property has a land size of 562m2 and floor size of 353m2. While the property is not currently for sale or for rent, it was last sold in June 2021.
Last Listing description (January 2009)
GO FOR IT !!!
GET THE GRANT ! STOP PAYING RENT ! DONT MISS THIS HOME LESS THAN 10 MINUTES WALK TO THE STATION, LOVELY LEVEL BLOCK, MAKE THIS YOUR 1ST DREAM HOME, FEATURES POLISHED TIMBER FLOORS, 3 SPACIOUS BEDROOMS, OPEN PLAN KITCHEN, DINING, SEPARATE LOUNGE ROOM, BRIGHT BATHROOM WITH SEPARATE TOILET, SINGLE DRIVE THROUGH GARAGE PLUS CARPORT. BE VERY QUICK FOR THIS ONE, PHONE DUNSHEAS 9605 7777 TO INSPECT TODAY.
Property History for 4 Belford St, Ingleburn, NSW 2565
- 08 Jun 2021Sold for $21,600
- 24 Jan 2009Listed for Rent - Price not available
- 21 Dec 2008Listed for Sale $240,000-$290,000

Recent sales nearby
See more recent sales nearbySimilar properties For Sale nearby
See more properties for sale nearby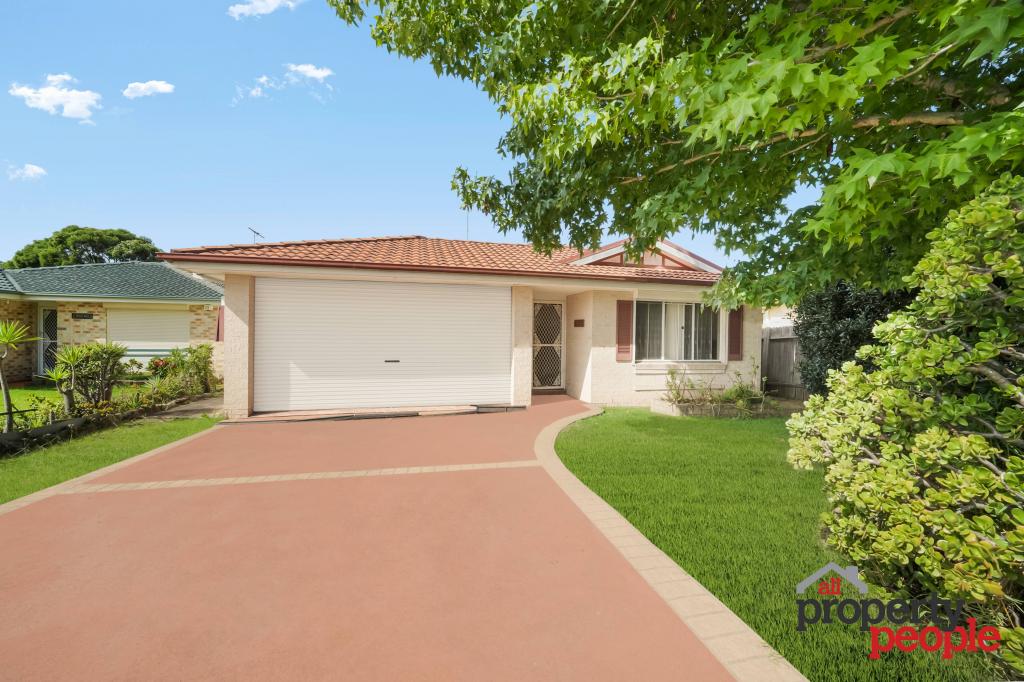 0
0
 0
0 0
0Similar properties For Rent nearby
See more properties for rent nearby 0
0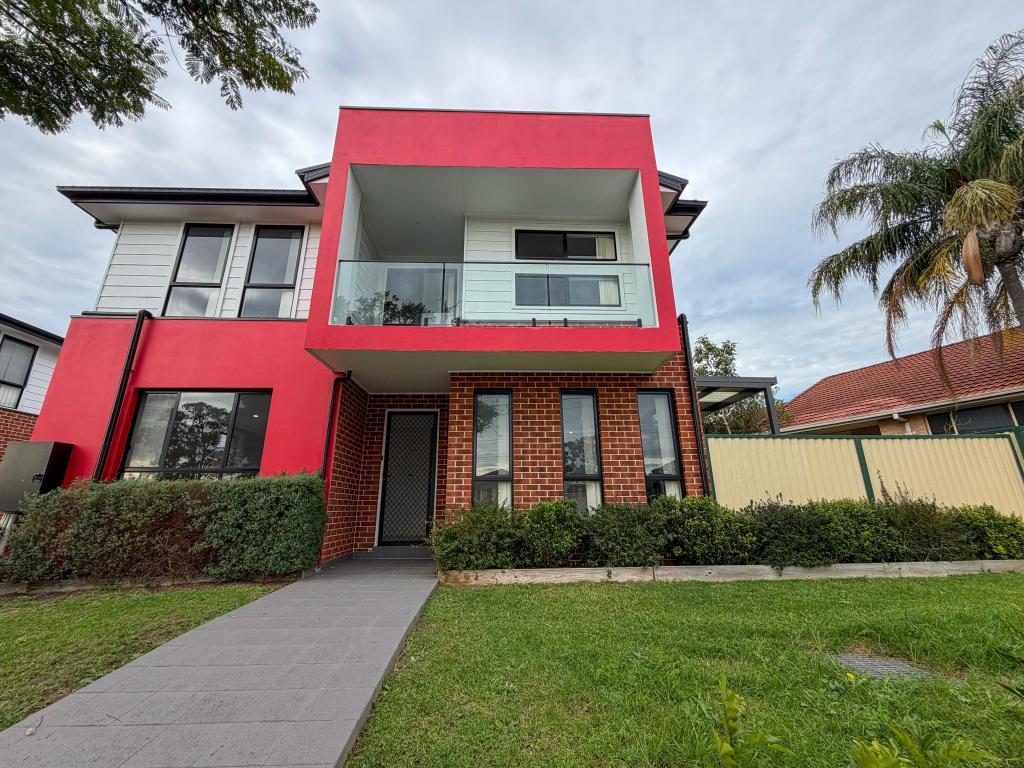 0
0 0
0About Ingleburn 2565
The size of Ingleburn is approximately 12.3 square kilometres. There are 23 parks, covering nearly 4.7% of the total area. The population of Ingleburn in 2016 was 15039 people. By 2021 the population was 15264 showing a population growth of 1.5% in the area during that time. The predominant age group in Ingleburn is 30-39 years. Households in Ingleburn are primarily couples with children and are likely to be repaying $1800 - $2399 per month on mortgage repayments. In general, people in Ingleburn work in a professional occupation.In 2021, 63.80% of the homes in Ingleburn were owner-occupied compared with 65.10% in 2016.
Ingleburn has 7,882 properties. Over the last 5 years, Houses in Ingleburn have seen a 45.42% increase in median value, while Units have seen a 49.17% increase. As at 31 May 2026:
- The median value for Houses in Ingleburn is $1,099,988 while the median value for Units is $706,945.
- Houses have a median rent of $650 while Units have a median rent of $560.
Suburb Insights for Ingleburn 2565
Market Insights
Ingleburn Trends for Houses
N/A
N/A
View TrendN/A
N/A
Ingleburn Trends for Units
N/A
N/A
View TrendN/A
N/A
Neighbourhood Insights
© Copyright 2026. RP Data Pty Ltd trading as Cotality (Cotality). All rights reserved. No reproduction, distribution, or transmission of the copyrighted materials is permitted. The information is deemed reliable but not guaranteed.
While Cotality uses commercially reasonable efforts to ensure the Cotality Data is current, Cotality does not warrant the accuracy, currency or completeness of the Cotality Data and to the full extent permitted by law excludes all loss or damage howsoever arising (including through negligence) in connection with the Cotality Data.
This product uses cookies and other similar technologies to improve and customise your browsing experience, to tailor content and adverts, and for analytics and metrics regarding visitor usage on this product and other media. We may share cookie and analytics information with third parties for the purposes of advertising. By continuing to use our website, you consent to cookies being used. View our Privacy Policy here.
X