
3 Lancaster StreetIngleburn NSW 2565
Property Details for 3 Lancaster St, Ingleburn
Last Listing description (April 2023)
Located within the Ingleburn Industrial precinct, offering excellent street exposure, this industrial unit is positioned within a popular complex. Some features include:
Large open-span clearance
Approximately 24m x 24m working space
2 x roller doors, one with loading bay
Toilets & Kitchen
Open plan mezzanine office
Coming available soon
To arrange an inspection or to discuss this opportunity further please contact the nominated listing agents at Raine & Horne Commercial Liverpool on 9600 7666 or:
Bruce Schell 0417 29 261
Stefan Baudana 0407 219 799
Property History for 3 Lancaster St, Ingleburn, NSW 2565
- 26 Apr 2023Listed for Rent - Price not available
- 20 Oct 2022Listed for Rent - Price not available
- 08 Dec 2017Listed for Rent $20,000 / year
Recent sales nearby
See more recent sales nearbySimilar properties For Sale nearby
See more properties for sale nearby 0
0 0
0 0
0Similar properties For Rent nearby
See more properties for rent nearby 0
0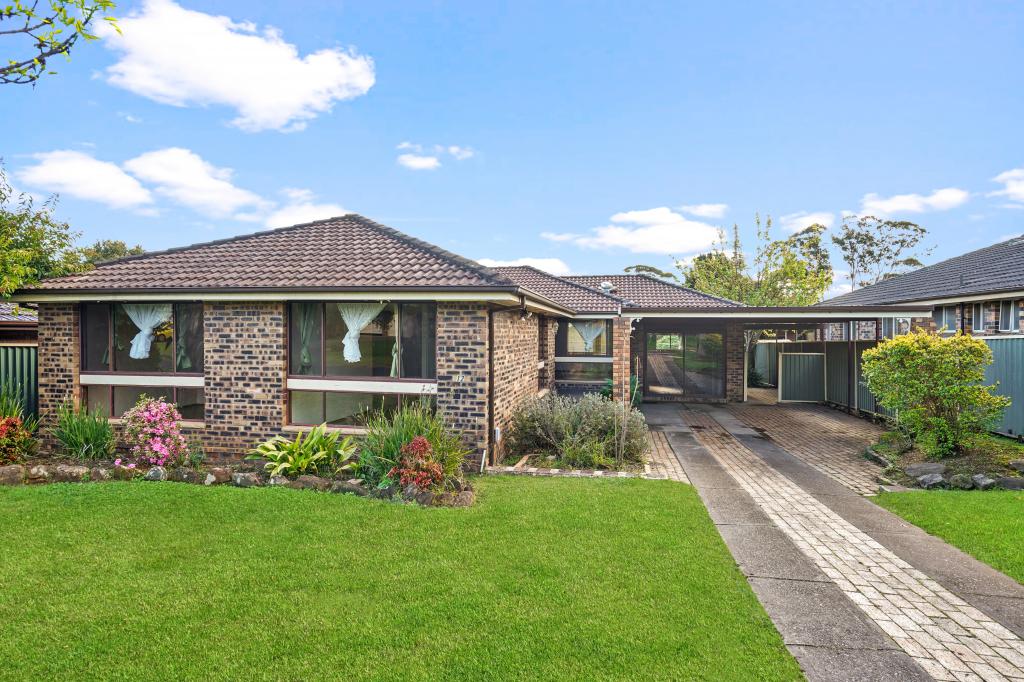 0
0 0
0About Ingleburn 2565
The size of Ingleburn is approximately 12.3 square kilometres. It has 23 parks covering nearly 4.7% of total area. The population of Ingleburn in 2016 was 15039 people. By 2021 the population was 15264 showing a population growth of 1.5% in the area during that time. The predominant age group in Ingleburn is 30-39 years. Households in Ingleburn are primarily couples with children and are likely to be repaying $1800 - $2399 per month on mortgage repayments. In general, people in Ingleburn work in a professional occupation.In 2021, 63.80% of the homes in Ingleburn were owner-occupied compared with 65.10% in 2016.
Ingleburn has 7,868 properties. Over the last 5 years, Houses in Ingleburn have seen a 49.03% increase in median value, while Units have seen a 51.75% increase. As at 31 March 2026:
- The median value for Houses in Ingleburn is $1,083,259 while the median value for Units is $699,483.
- Houses have a median rent of $650 while Units have a median rent of $550.
Suburb Insights for Ingleburn 2565
Market Insights
Ingleburn Trends for Houses
N/A
N/A
View TrendN/A
N/A
Ingleburn Trends for Units
N/A
N/A
View TrendN/A
N/A
Neighbourhood Insights
© Copyright 2026. RP Data Pty Ltd trading as Cotality (Cotality). All rights reserved. No reproduction, distribution, or transmission of the copyrighted materials is permitted. The information is deemed reliable but not guaranteed.
While Cotality uses commercially reasonable efforts to ensure the Cotality Data is current, Cotality does not warrant the accuracy, currency or completeness of the Cotality Data and to the full extent permitted by law excludes all loss or damage howsoever arising (including through negligence) in connection with the Cotality Data.
This product uses cookies and other similar technologies to improve and customise your browsing experience, to tailor content and adverts, and for analytics and metrics regarding visitor usage on this product and other media. We may share cookie and analytics information with third parties for the purposes of advertising. By continuing to use our website, you consent to cookies being used. View our Privacy Policy here.
X