
29 Belford StreetIngleburn NSW 2565
Property Details for 29 Belford St, Ingleburn
29 Belford St, Ingleburn is a 3 bedroom, 1 bathroom House and was built in 1960. The property has a land size of 500m2 and floor size of 100m2. While the property is not currently for sale or for rent, it was last sold in December 2013.
Last Listing description (December 2013)
This much loved 3 bedroom home is located within easy walking distance to the station, shops & schools & has something to please the whole family. Beautifully presented kitchen and bathroom, timber floors, mirrored built-in robes, spacious sunroom, separate studio or workshop & a sparkling fully fenced inground pool for summer entertaining. A great start for the first home buyer looking to get off the rental treadmill into the market.
Call Sharon on 0413 406 787 for an appointment to inspect.
Property History for 29 Belford St, Ingleburn, NSW 2565
- 03 Dec 2013Sold for $386,500
- 29 Nov 2013Listed for Sale UNDER CONTRACT
- 01 Feb 1991Sold for $100,000

Recent sales nearby
See more recent sales nearby
Similar properties For Sale nearby
See more properties for sale nearby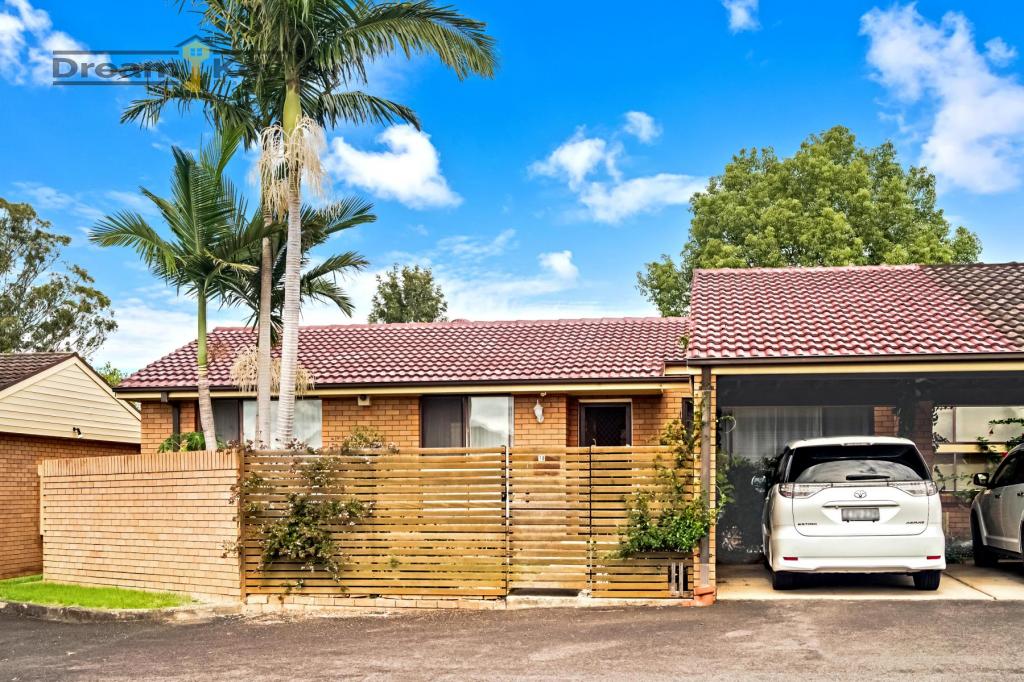 0
0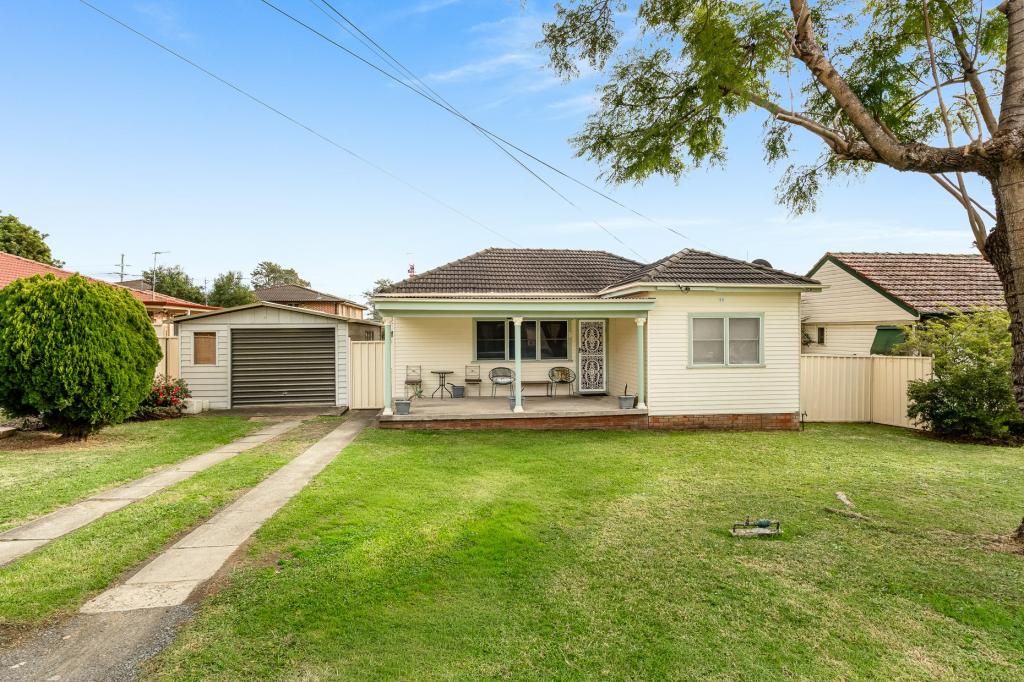 0
0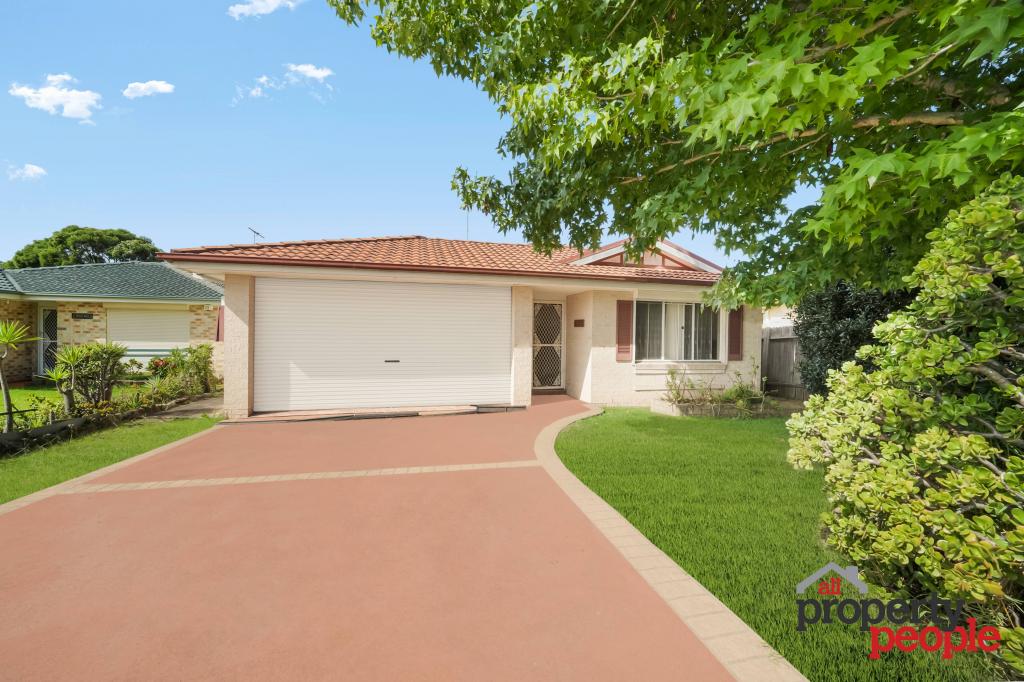 0
0
Similar properties For Rent nearby
See more properties for rent nearby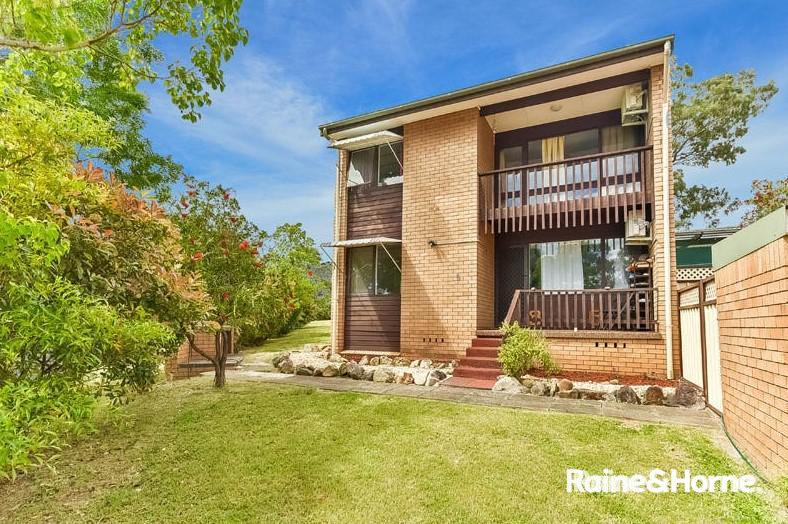 0
0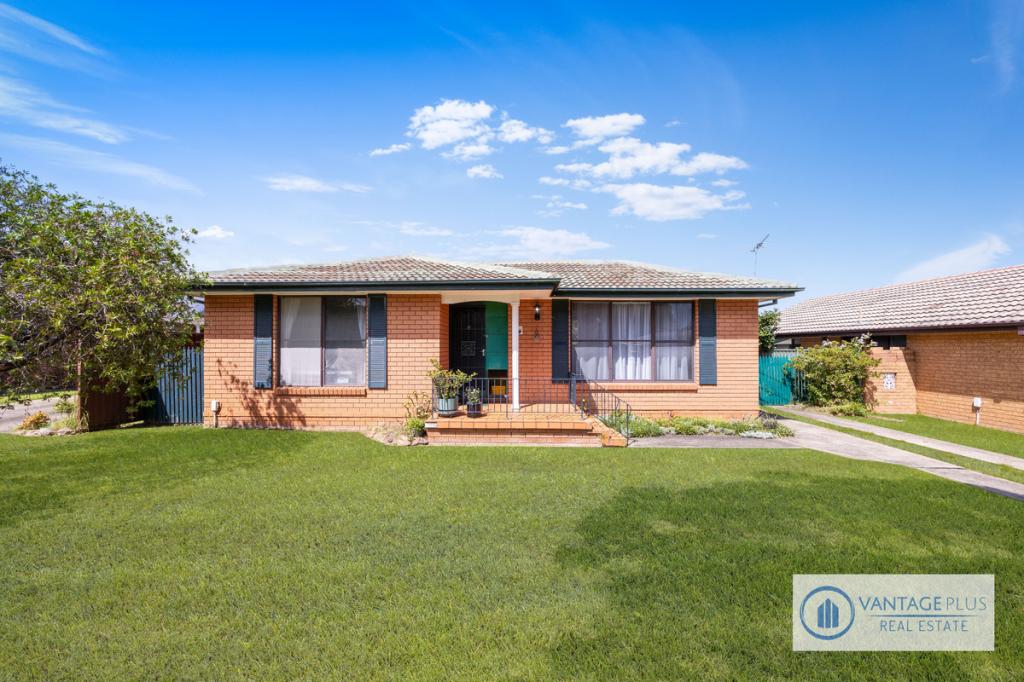 0
0 0
0About Ingleburn 2565
The size of Ingleburn is approximately 12.3 square kilometres. There are 23 parks, covering nearly 4.7% of the total area. The population of Ingleburn in 2016 was 15039 people. By 2021 the population was 15264 showing a population growth of 1.5% in the area during that time. The predominant age group in Ingleburn is 30-39 years. Households in Ingleburn are primarily couples with children and are likely to be repaying $1800 - $2399 per month on mortgage repayments. In general, people in Ingleburn work in a professional occupation.In 2021, 63.80% of the homes in Ingleburn were owner-occupied compared with 65.10% in 2016.
Ingleburn has 7,891 properties. Over the last 5 years, Houses in Ingleburn have seen a 41.33% increase in median value, while Units have seen a 54.59% increase. As at 30 June 2026:
- The median value for Houses in Ingleburn is $1,100,789 while the median value for Units is $717,971.
- Houses have a median rent of $650 while Units have a median rent of $560.
Suburb Insights for Ingleburn 2565
Market Insights
Ingleburn Trends for Houses
N/A
N/A
View TrendN/A
N/A
Ingleburn Trends for Units
N/A
N/A
View TrendN/A
N/A
Neighbourhood Insights
© Copyright 2026. RP Data Pty Ltd trading as Cotality (Cotality). All rights reserved. No reproduction, distribution, or transmission of the copyrighted materials is permitted. The information is deemed reliable but not guaranteed.
While Cotality uses commercially reasonable efforts to ensure the Cotality Data is current, Cotality does not warrant the accuracy, currency or completeness of the Cotality Data and to the full extent permitted by law excludes all loss or damage howsoever arising (including through negligence) in connection with the Cotality Data.
This product uses cookies and other similar technologies to improve and customise your browsing experience, to tailor content and adverts, and for analytics and metrics regarding visitor usage on this product and other media. We may share cookie and analytics information with third parties for the purposes of advertising. By continuing to use our website, you consent to cookies being used. View our Privacy Policy here.
X