
7/15 Dick StreetHenley NSW 2111
Property Details for 7/15 Dick St, Henley
7/15 Dick St, Henley is a 3 bedroom, 2 bathroom Unit with 2 parking spaces and was built in 2001. The property has a land size of 371m2 and floor size of 371m2. While the property is not currently for sale or for rent, it was last sold in June 2020.
Last Listing description (June 2020)
Water views and spectacular sunsets from both levels
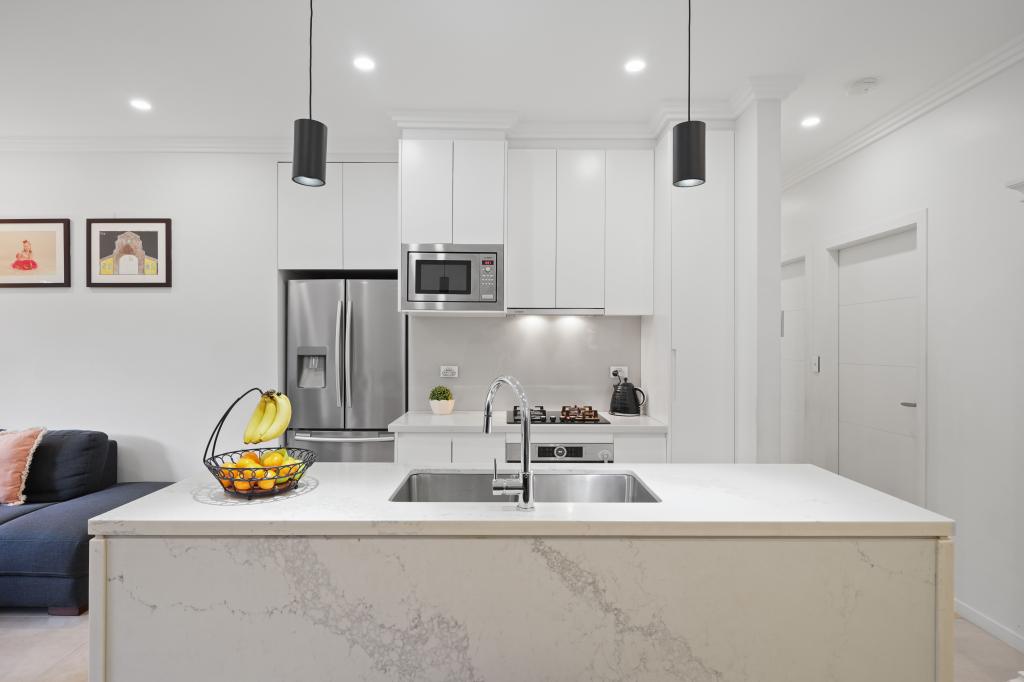
Open plan living flows to outdoor terrace and entertaining
Master bedroom with ensuite, walk in robe, balcony, sparkling water views
Second living space and perfect home cinema or games room
Newly renovated gas kitchen, large laundry, guest powder room
Double lock-up garage with internal access and good storage
Launch a kayak from the beach, hop on a water taxi or fish from the pontoon
Quick access to CBD via Victoria Road bus or regular Rivercat ferry services
Short walk/drive to Gladesville and Hunters Hill shopping precincts
Property History for 7/15 Dick St, Henley, NSW 2111
- 24 Jun 2020Sold for $3,500,000
- 15 Aug 2019Listed for Sale Price on request
- 14 Dec 2017Sold for $3,030,000

Recent sales nearby
See more recent sales nearbySimilar properties For Sale nearby
See more properties for sale nearby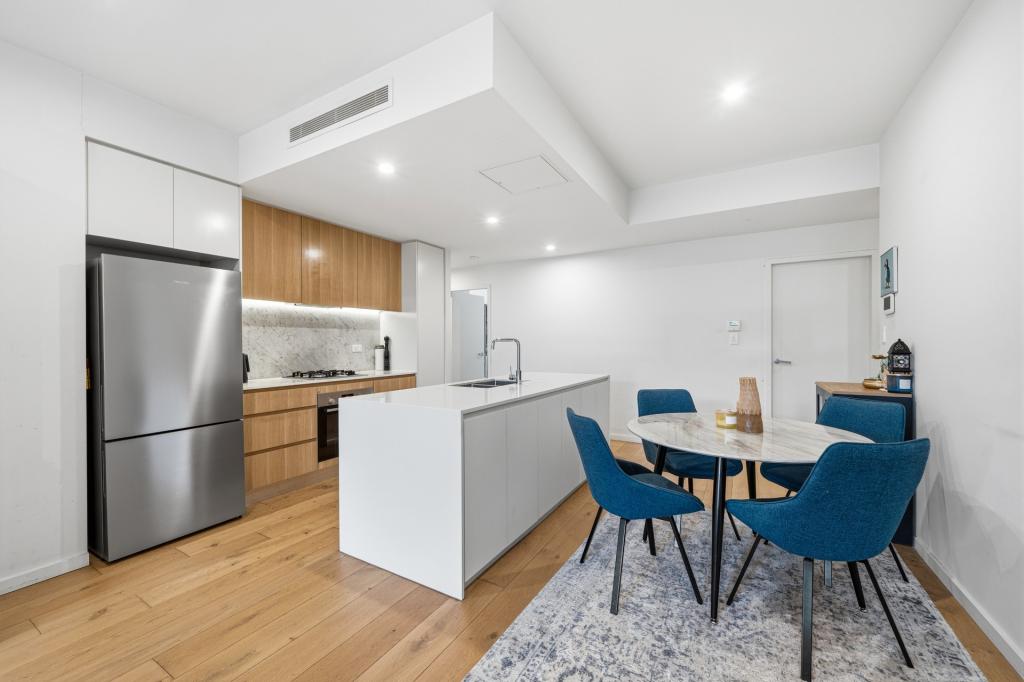 0
0
 0
0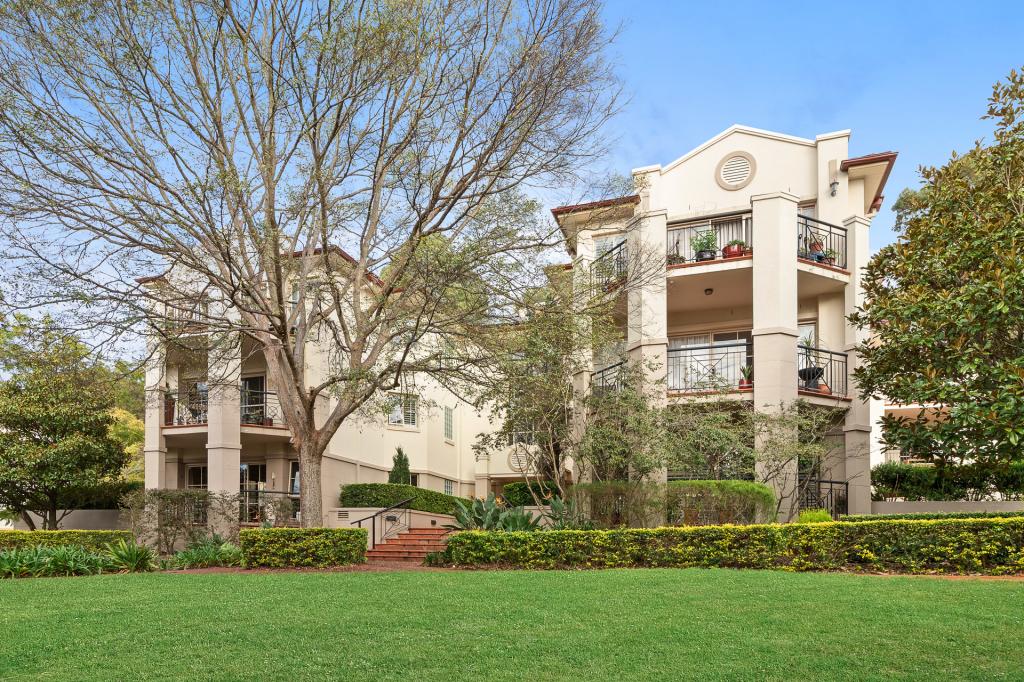 0
0
Similar properties For Rent nearby
See more properties for rent nearby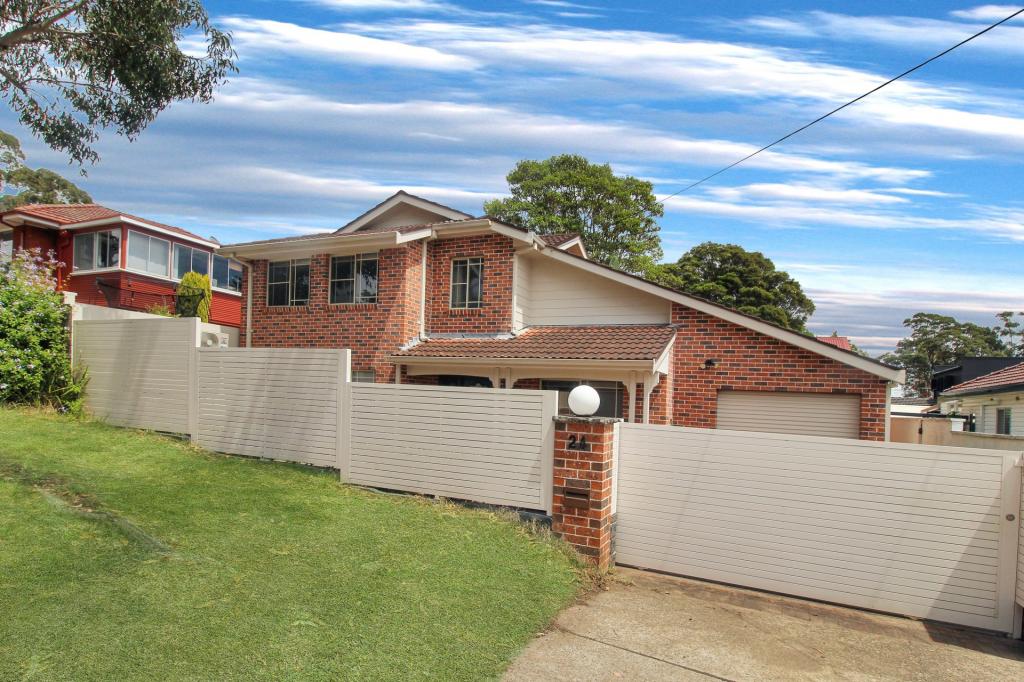 0
0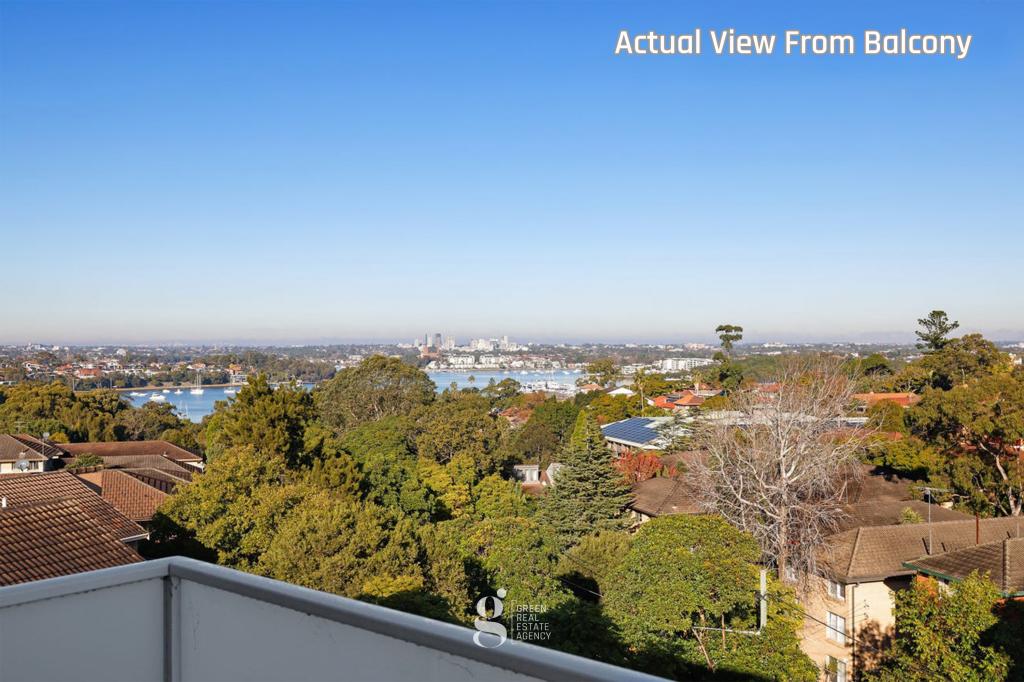 0
0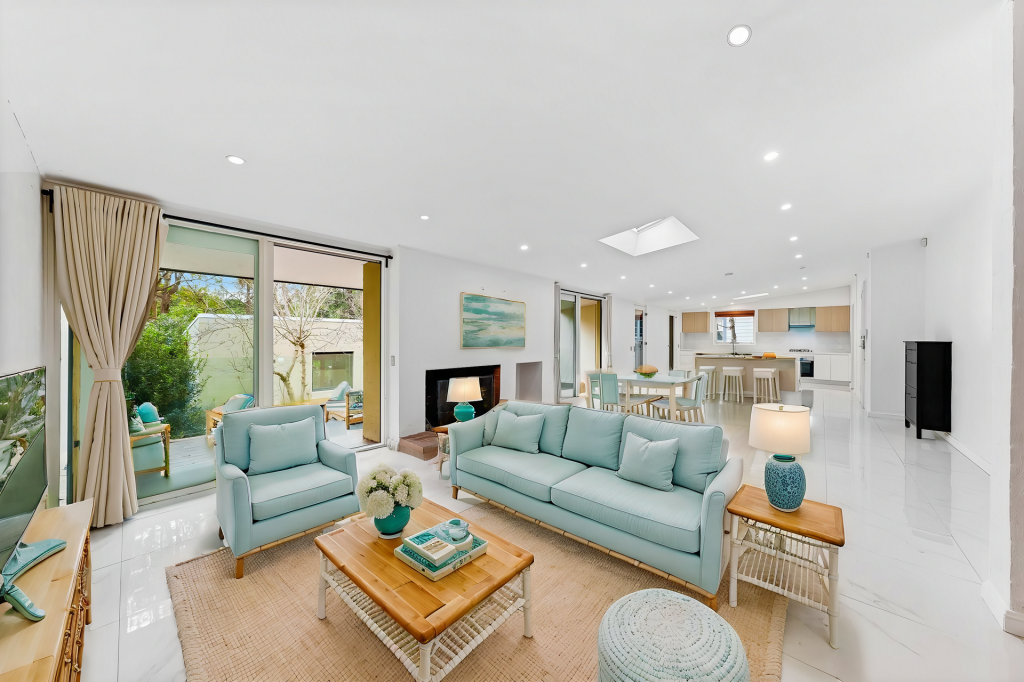 0
0About Henley 2111
The size of Henley is approximately 0.3 square kilometres. There are 2 parks, covering nearly 33.5% of the total area. The population of Henley in 2016 was 469 people. By 2021 the population was 455 showing a population decline of 3.0% in the area during that time. The predominant age group in Henley is 50-59 years. Households in Henley are primarily couples with children and are likely to be repaying over $4000 per month on mortgage repayments. In general, people in Henley work in a professional occupation.In 2021, 84.60% of the homes in Henley were owner-occupied compared with 79.10% in 2016.
Henley has 197 properties. Over the last 5 years, Houses in Henley have seen a -17.42% decrease in median value, while Units have seen a 32.03% increase. As at 30 June 2026:
- The median value for Houses in Henley is $3,651,765 while the median value for Units is $1,581,549.
Suburb Insights for Henley 2111
Market Insights
Henley Trends for Houses
N/A
N/A
View TrendN/A
N/A
Henley Trends for Units
N/A
N/A
View TrendN/A
N/A
Neighbourhood Insights
© Copyright 2026. RP Data Pty Ltd trading as Cotality (Cotality). All rights reserved. No reproduction, distribution, or transmission of the copyrighted materials is permitted. The information is deemed reliable but not guaranteed.
While Cotality uses commercially reasonable efforts to ensure the Cotality Data is current, Cotality does not warrant the accuracy, currency or completeness of the Cotality Data and to the full extent permitted by law excludes all loss or damage howsoever arising (including through negligence) in connection with the Cotality Data.
This product uses cookies and other similar technologies to improve and customise your browsing experience, to tailor content and adverts, and for analytics and metrics regarding visitor usage on this product and other media. We may share cookie and analytics information with third parties for the purposes of advertising. By continuing to use our website, you consent to cookies being used. View our Privacy Policy here.
X