
69 Dee Why ParadeDee Why NSW 2099
Property Details for 69 Dee Why Pde, Dee Why
69 Dee Why Pde, Dee Why is a 5 bedroom, 3 bathroom House with 2 parking spaces and was built in 1985. The property has a land size of 375m2 and floor size of 169m2. While the property is not currently for sale or for rent, it was last sold in June 2007.
Last Listing description (May 2026)
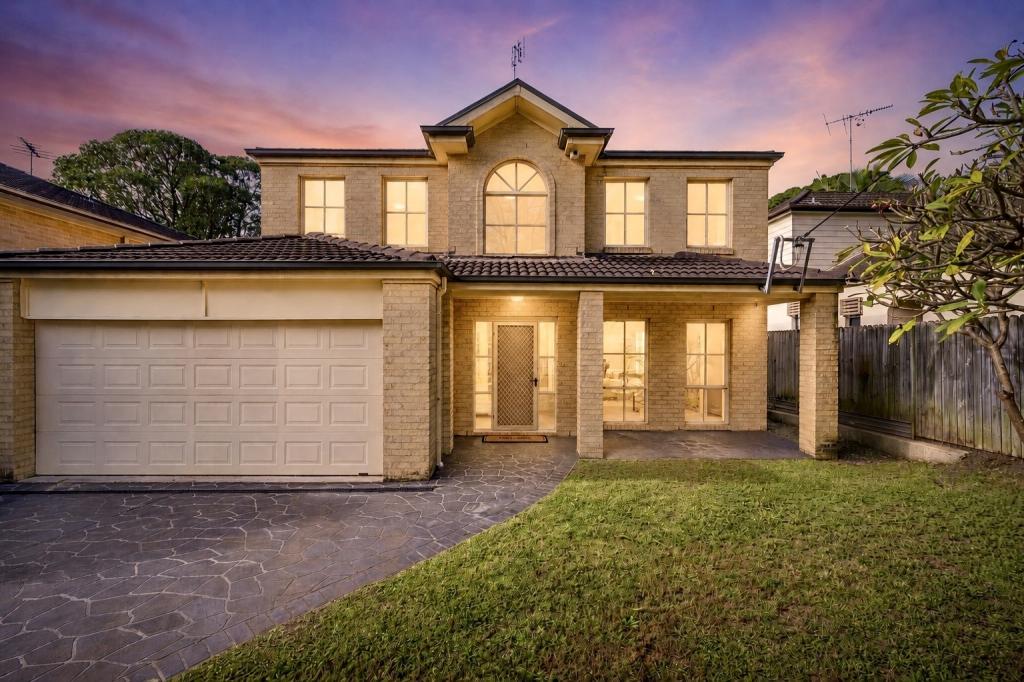
Set within a solid double brick residence, this generously proportioned home delivers exceptional space, flexibility and lifestyle in one of Dee Why's most convenient pockets. Offering a versatile five-bedroom layout across two levels, it's perfectly suited to families, professionals or those seeking additional work-from-home space.
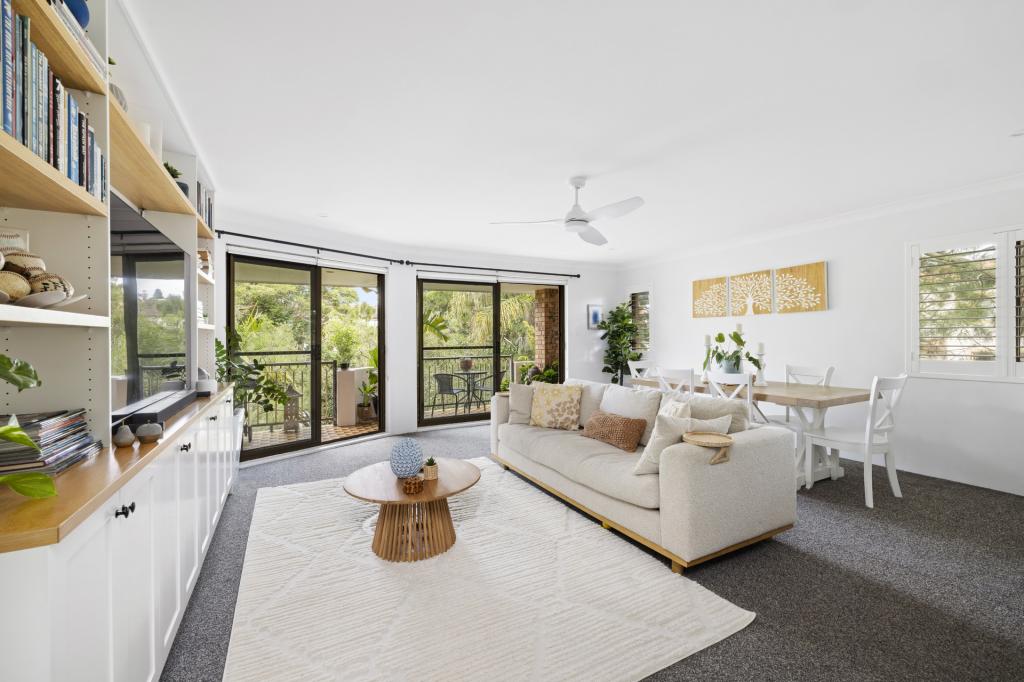
Upstairs reveals a light-filled open plan kitchen, living and dining zone that flows seamlessly to a covered balcony, ideal for relaxed everyday living and entertaining. Downstairs provides additional accommodation options including a second living or guest zone, complemented by direct access to the backyard and outdoor entertaining area.
Positioned just moments from Dee Why Beach, vibrant cafs, restaurants and the Meriton precinct, this home offers the ultimate coastal lifestyle with everything at your doorstep.
Main Features:
- Generous five-bedroom layout across two levels, ideal for families or flexible living
- Three well-appointed bathrooms, including ensuite to downstairs bedroom
- Open plan kitchen, living and dining area upstairs with great natural light
- Additional upstairs bedroom perfect as a home office, 5th bedroom or guest room
- Two bedrooms downstairs, both with built-in wardrobes, one with ensuite
- Two further bedrooms upstairs, both with built-ins, one with ceiling fan
- Functional kitchen with ample storage and bench space
- Family bathroom with separate bath, shower and vanity
- Polished pine floorboards throughout living areas
- Under-stair storage plus linen cupboard for added practicality
- Lock-up garage with internal access plus additional driveway parking
- Separate workroom behind garage with direct garden access
- Outdoor entertaining area with covered patio and level grassed yard
- Positioned approximately 250m to Dee Why Beach and beachfront cafs
- Moments to Dee Why town centre, Meriton precinct, shops and supermarkets
- Easy access to express B-Line buses for a convenient CBD commute
*PLEASE NOTE* It is important that you enquire to register for an inspection, so we are able to advise you of time changes, cancellations and price reductions.
Property History for 69 Dee Why Pde, Dee Why, NSW 2099
- 01 May 2026Listed for Rent $1,850 / week
- 05 Apr 2014Listed for Sale Not Disclosed
- 14 Jun 2007Sold for $970,000

Recent sales nearby
See more recent sales nearbySimilar properties For Sale nearby
See more properties for sale nearby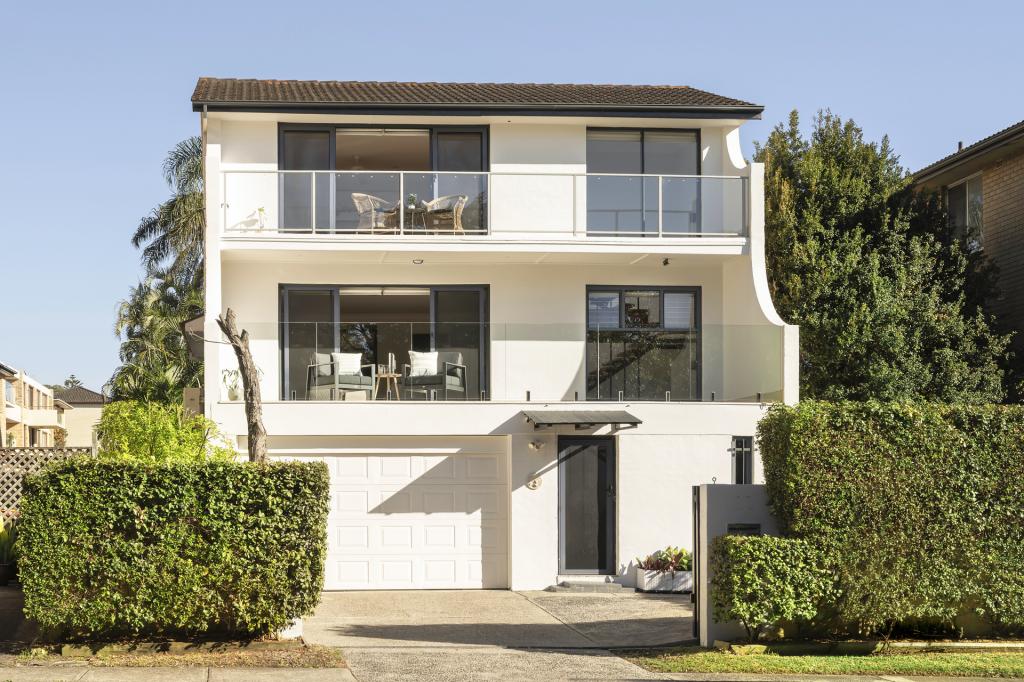 0
0
 0
0
 0
0Similar properties For Rent nearby
See more properties for rent nearby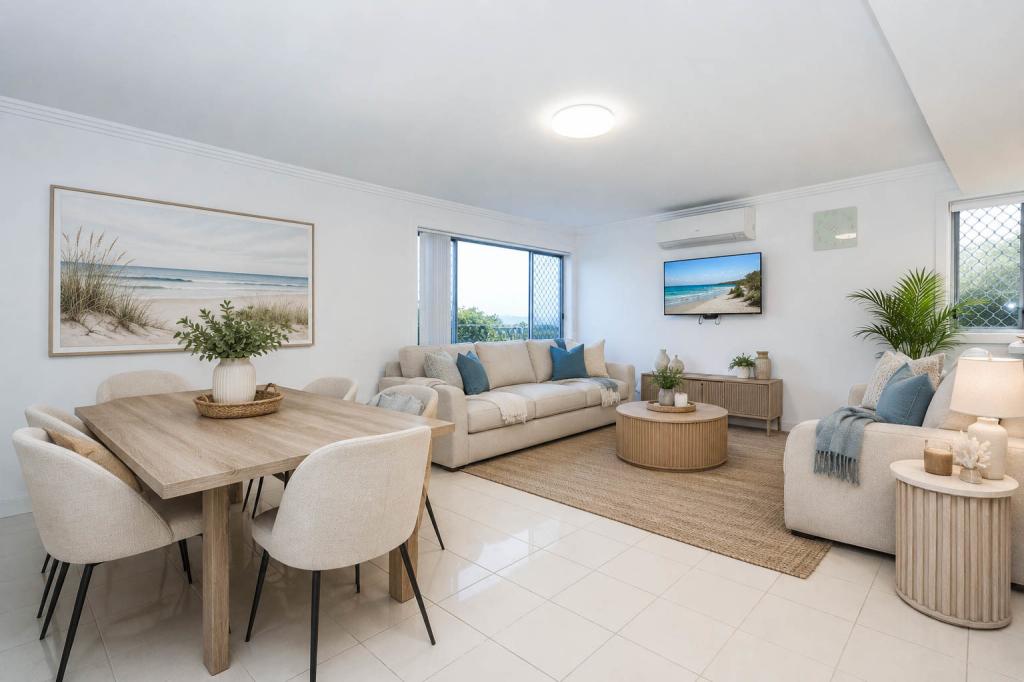 0
0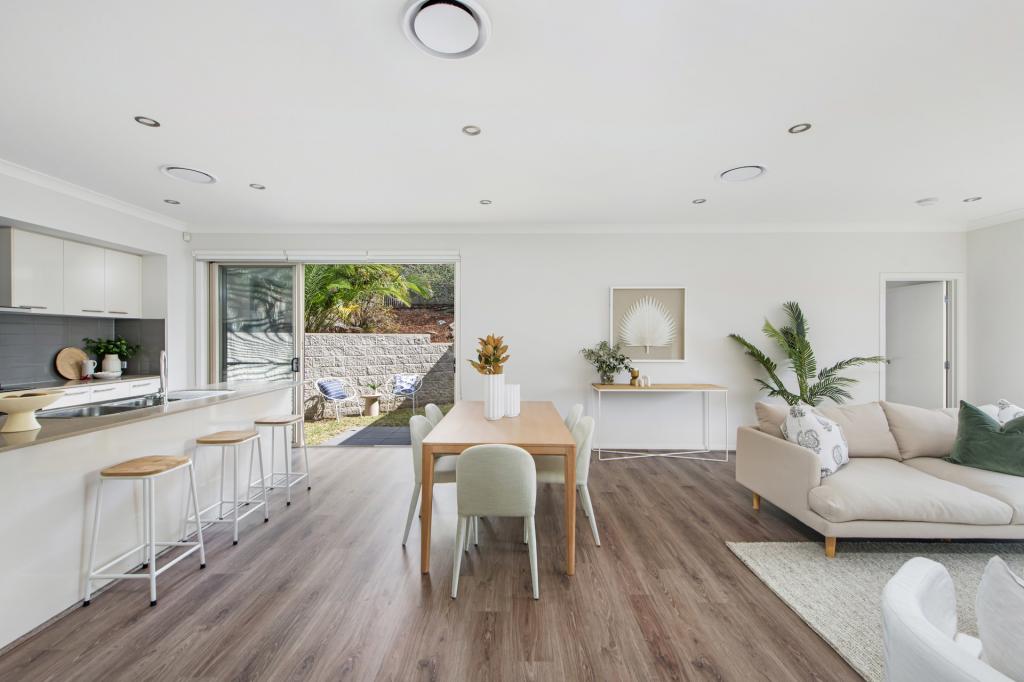 0
0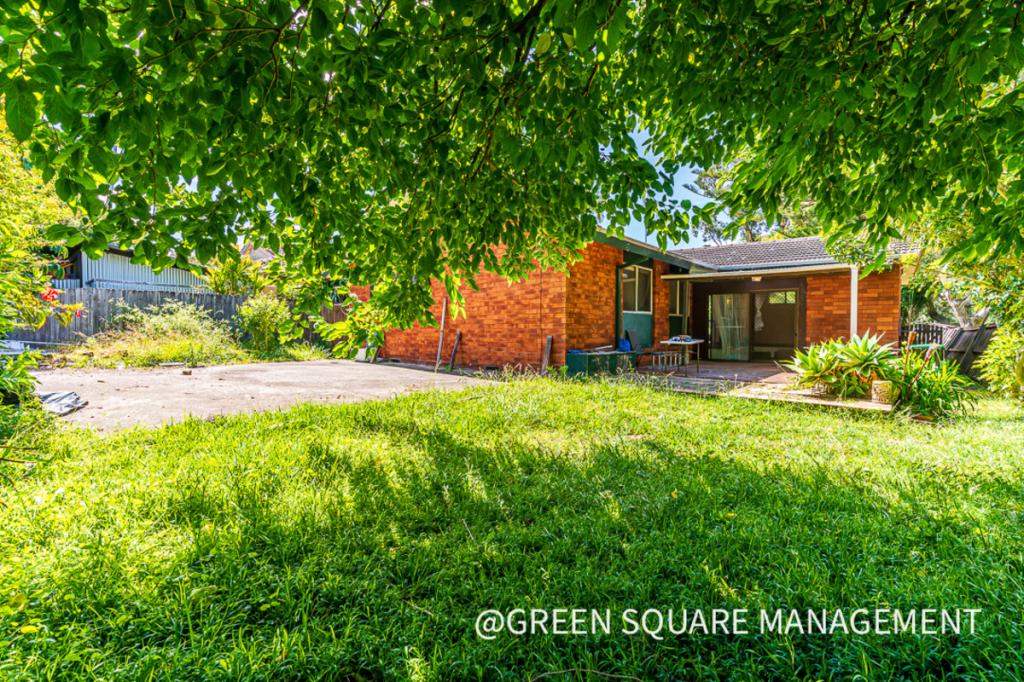 0
0
About Dee Why 2099
The size of Dee Why is approximately 3.4 square kilometres. There are 11 parks, covering nearly 15.0% of the total area. The population of Dee Why in 2016 was 21518 people. By 2021 the population was 23354 showing a population growth of 8.5% in the area during that time. The predominant age group in Dee Why is 30-39 years. Households in Dee Why are primarily childless couples and are likely to be repaying $1800 - $2399 per month on mortgage repayments. In general, people in Dee Why work in a professional occupation.In 2021, 50.20% of the homes in Dee Why were owner-occupied compared with 50.30% in 2016.
Dee Why has 13,267 properties. Over the last 5 years, Houses in Dee Why have seen a 7.44% increase in median value, while Units have seen a 8.28% increase. As at 30 June 2026:
- The median value for Houses in Dee Why is $2,701,888 while the median value for Units is $1,066,107.
- Houses have a median rent of $1,400 while Units have a median rent of $800.
Suburb Insights for Dee Why 2099
Market Insights
Dee Why Trends for Houses
N/A
N/A
View TrendN/A
N/A
Dee Why Trends for Units
N/A
N/A
View TrendN/A
N/A
Neighbourhood Insights
© Copyright 2026. RP Data Pty Ltd trading as Cotality (Cotality). All rights reserved. No reproduction, distribution, or transmission of the copyrighted materials is permitted. The information is deemed reliable but not guaranteed.
While Cotality uses commercially reasonable efforts to ensure the Cotality Data is current, Cotality does not warrant the accuracy, currency or completeness of the Cotality Data and to the full extent permitted by law excludes all loss or damage howsoever arising (including through negligence) in connection with the Cotality Data.
This product uses cookies and other similar technologies to improve and customise your browsing experience, to tailor content and adverts, and for analytics and metrics regarding visitor usage on this product and other media. We may share cookie and analytics information with third parties for the purposes of advertising. By continuing to use our website, you consent to cookies being used. View our Privacy Policy here.
X