
6/3 Wheeler ParadeDee Why NSW 2099
Property Details for 6/3 Wheeler Pde, Dee Why
6/3 Wheeler Pde, Dee Why is a 2 bedroom, 1 bathroom Unit with 1 parking spaces and was built in 1970. The property has a land size of 94m2 and floor size of 81m2. While the property is not currently for sale or for rent, it was last sold in May 2024.
Last Listing description (June 2024)
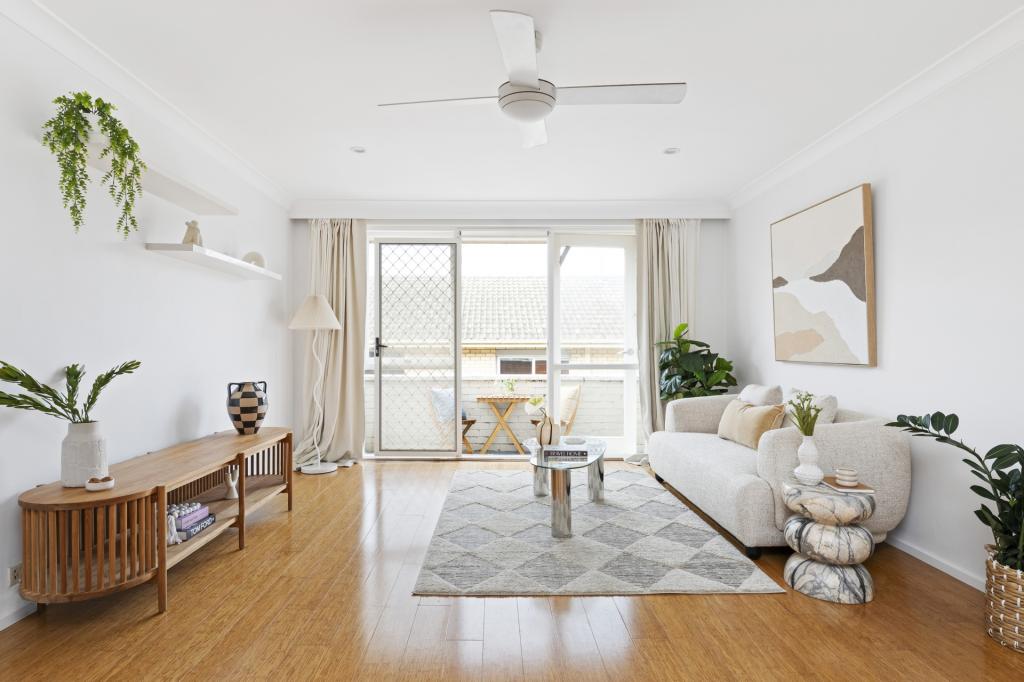
Embrace the essence of beachside living with this sun-drenched apartment positioned in a blue-ribbon Dee Why address. Offering the perfect blend of convenience and coastal bliss, with its footstep access to the gorgeous Dee Why beach, beachside treasures, vibrant town centre, cafes, shops, restaurants, Dee Why RSL, transport links, and schools, this inviting apartment is perfect for first-home owners, downsizers, and astute investors looking to enter the ever-growing Northern Beaches market.
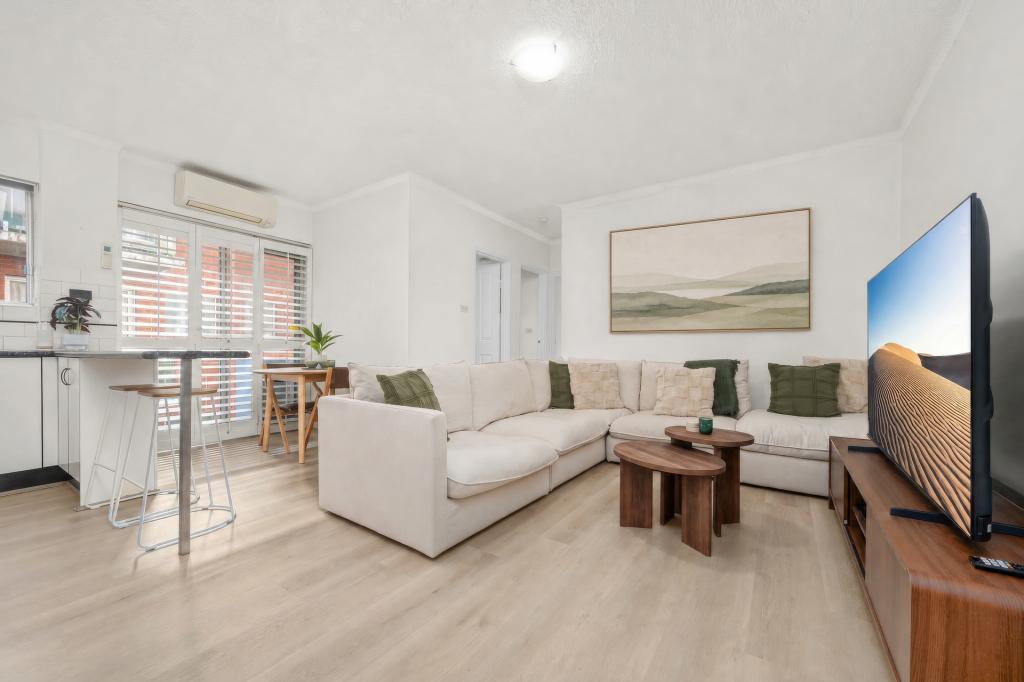
With a functional floorplan and sunlit interior, this apartment features a spacious kitchen with gas cooking and ample cupboard and bench space, plus an open-plan living and dining domain. Accommodation comprises of two generous bedrooms with private outlooks, the main adorned with a mirrored built-in wardrobe, whilst the bathroom is fresh bright and airy.
Other highlights include an internal laundry and carport.
Do not miss the opportunity to live the idyllic Northern Beaches lifestyle through this ultra-convenient apartment situated only a 5-minute walk from the beautiful Dee Why Beach!!
Total Titled Area - 84.4 sqm approx.
Water Rates - $173 pq approx.
Council Rates - $404 pq approx.
Strata Rates - $774 pq approx.
For further information or to arrange an inspection please call Matt Morley on 0418 168 932 and 9981 9416 and Stephen Murace on 0413 763 993 and 9981 9426.
Disclaimer: Whilst every care is taken in the preparation of the information contained in this marketing, Doyle Spillane Real Estate will not be held liable for any errors in typing or information. All interested parties should rely upon their own enquiries in order to determine whether or not this information is in fact accurate.
Property History for 6/3 Wheeler Pde, Dee Why, NSW 2099
- 09 May 2024Sold for $790,000
- 18 Apr 2024Listed for Sale Sold
- 26 Oct 2023Sold

Recent sales nearby
See more recent sales nearbySimilar properties For Sale nearby
See more properties for sale nearby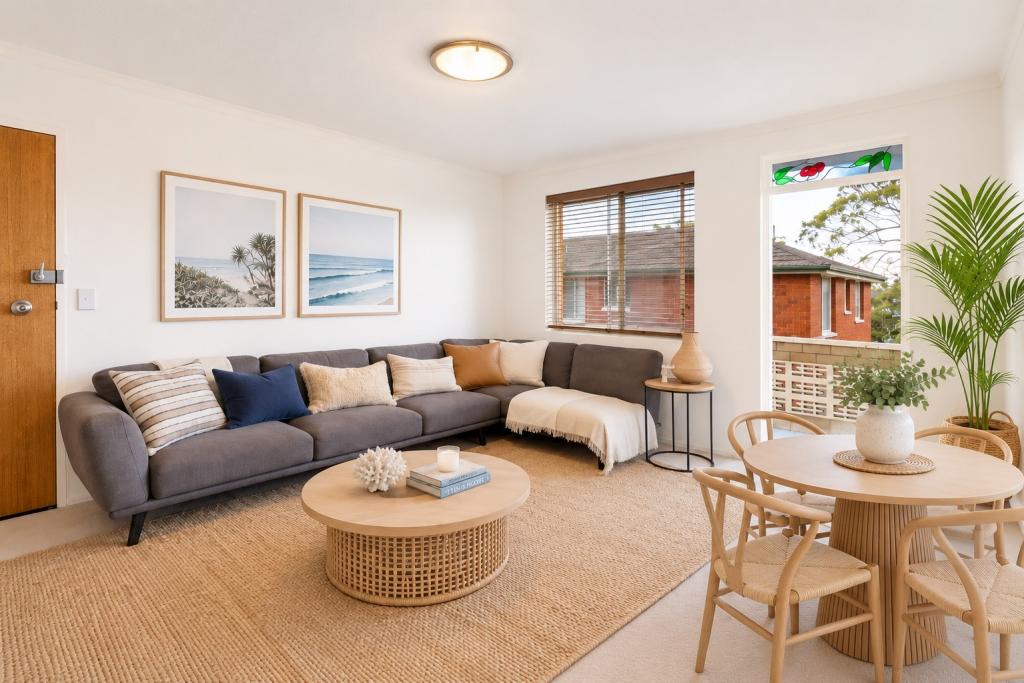 0
0
 0
0
 0
0Similar properties For Rent nearby
See more properties for rent nearby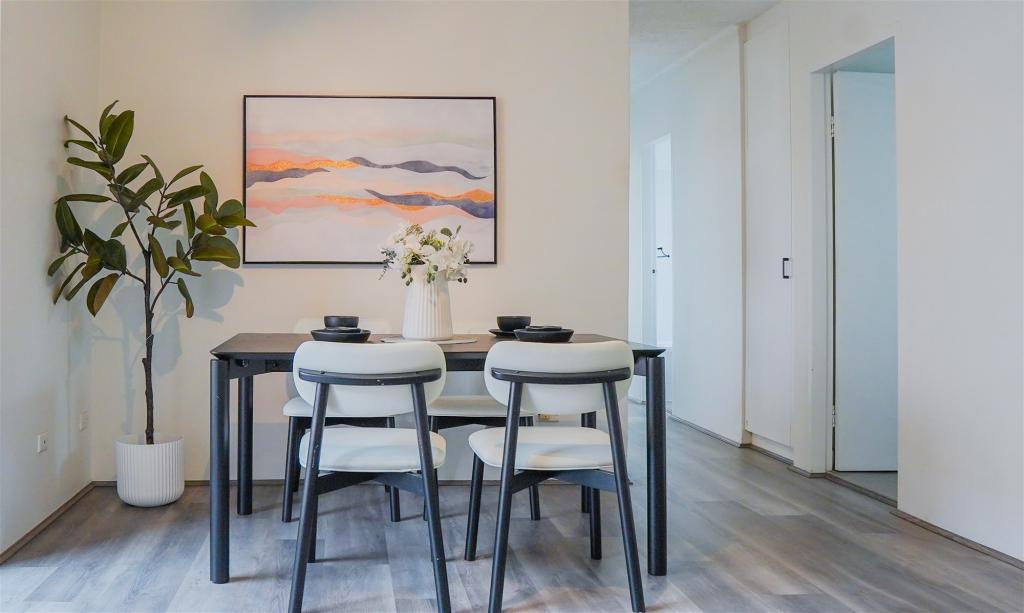 0
0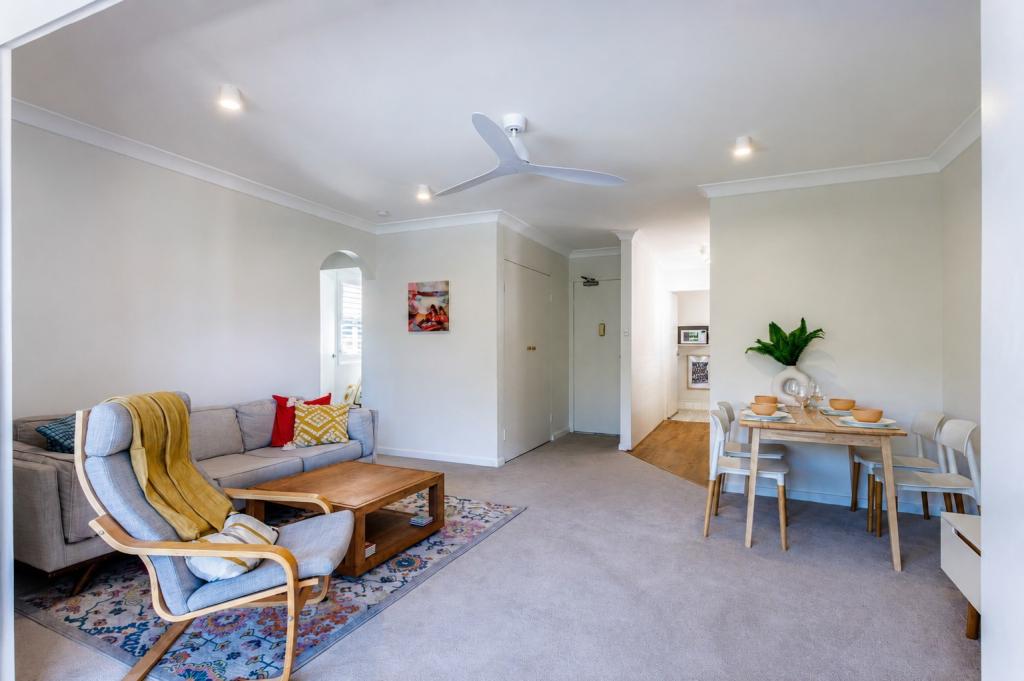 0
0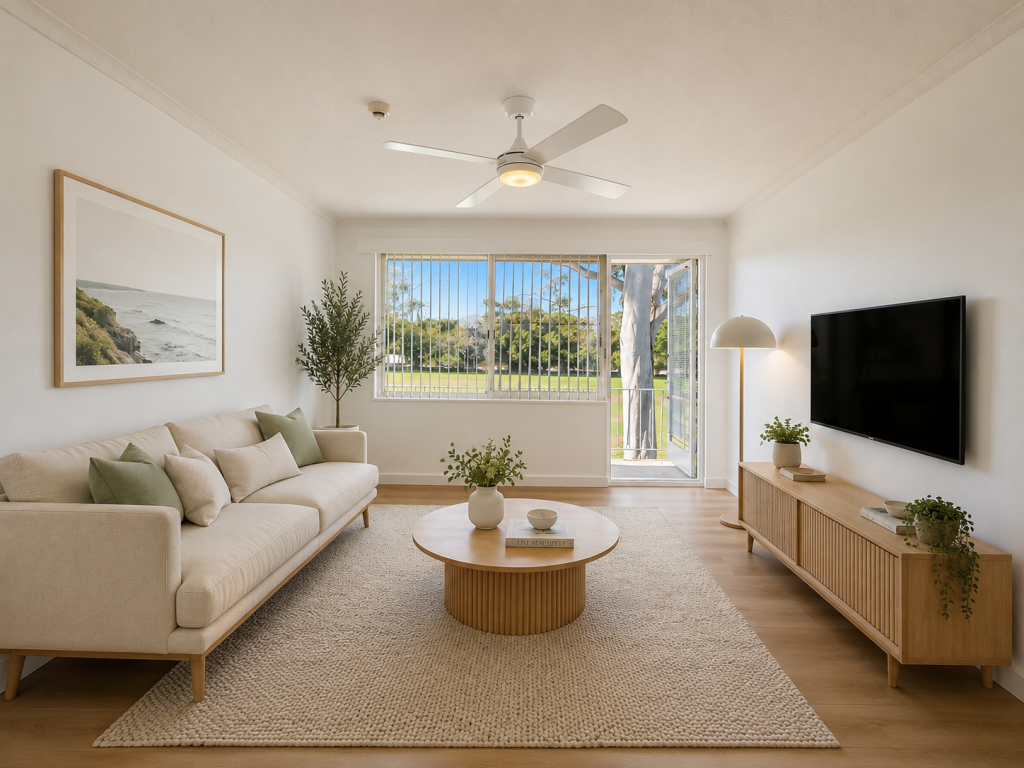 0
0About Dee Why 2099
The size of Dee Why is approximately 3.4 square kilometres. There are 11 parks, covering nearly 15.0% of the total area. The population of Dee Why in 2016 was 21518 people. By 2021 the population was 23354 showing a population growth of 8.5% in the area during that time. The predominant age group in Dee Why is 30-39 years. Households in Dee Why are primarily childless couples and are likely to be repaying $1800 - $2399 per month on mortgage repayments. In general, people in Dee Why work in a professional occupation.In 2021, 50.20% of the homes in Dee Why were owner-occupied compared with 50.30% in 2016.
Dee Why has 13,252 properties. Over the last 5 years, Houses in Dee Why have seen a 7.44% increase in median value, while Units have seen a 8.28% increase. As at 30 June 2026:
- The median value for Houses in Dee Why is $2,701,888 while the median value for Units is $1,066,107.
- Houses have a median rent of $1,400 while Units have a median rent of $800.
Suburb Insights for Dee Why 2099
Market Insights
Dee Why Trends for Houses
N/A
N/A
View TrendN/A
N/A
Dee Why Trends for Units
N/A
N/A
View TrendN/A
N/A
Neighbourhood Insights
© Copyright 2026. RP Data Pty Ltd trading as Cotality (Cotality). All rights reserved. No reproduction, distribution, or transmission of the copyrighted materials is permitted. The information is deemed reliable but not guaranteed.
While Cotality uses commercially reasonable efforts to ensure the Cotality Data is current, Cotality does not warrant the accuracy, currency or completeness of the Cotality Data and to the full extent permitted by law excludes all loss or damage howsoever arising (including through negligence) in connection with the Cotality Data.
This product uses cookies and other similar technologies to improve and customise your browsing experience, to tailor content and adverts, and for analytics and metrics regarding visitor usage on this product and other media. We may share cookie and analytics information with third parties for the purposes of advertising. By continuing to use our website, you consent to cookies being used. View our Privacy Policy here.
X