
6/149 Oaks AvenueDee Why NSW 2099
Property Details for 6/149 Oaks Ave, Dee Why
6/149 Oaks Ave, Dee Why is a 2 bedroom, 1 bathroom Townhouse with 1 parking spaces and was built in 1967. The property has a land size of 938m2 and floor size of 70m2. While the property is not currently for sale or for rent, it was last sold in March 2022.
Last Listing description (April 2022)
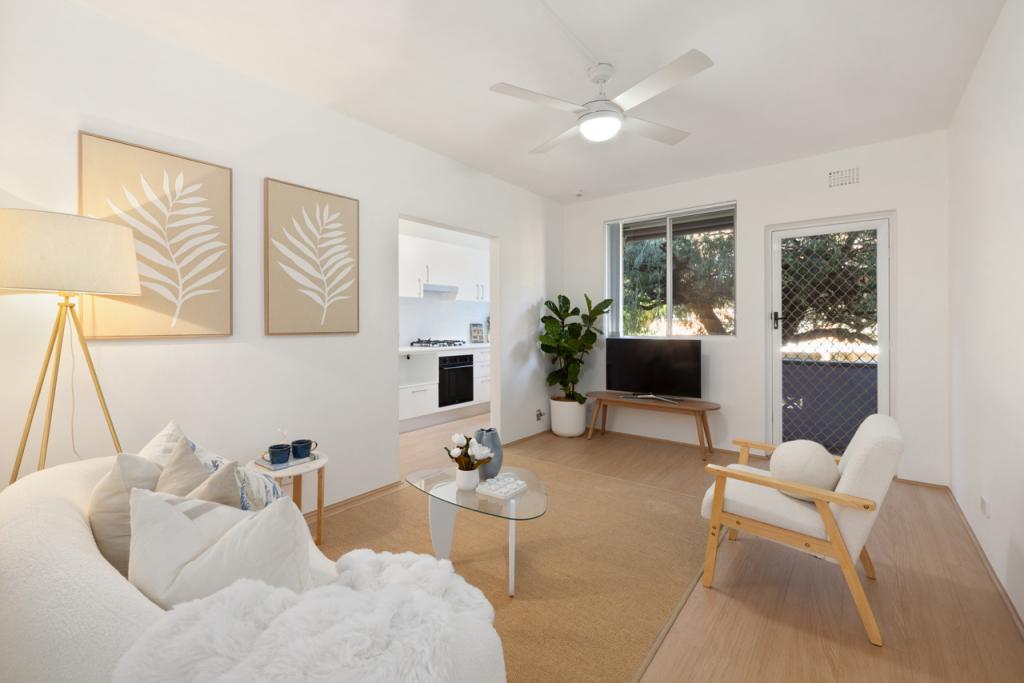
Tightly held and incredibly sought after, this rare beach-side security apartment of only 9 won't last long. Held in the one family for over 50 years, this iconic beachfront property is exceptional for investors, first home buyers or downsizers seeking the ultimate Northern Beaches lifestyle. This immaculate, sun-filled apartment is set within the highly prized "Balboa" beachfront complex, one of the Northern beaches most sought-after addresses, and is situated only footsteps from the water's edge, restaurants, pool, city buses and trendy beachside bars, creating an idyllic way of life.
The property is light filled and well-presented featuring a combined living/dining that flows onto a sundrenched balcony with magnificent water and beach views. The kitchen has been upgraded with an adjacent internal laundry room, both double bedrooms include built-in wardrobes and there is an original full-sized bathroom. An additional highlight includes the large auto lock up garage with extra storage.
Fall asleep at night to the sound of the waves lapping the shore, wake to the glorious morning sunrise and enjoy walks, swims, or a surf in this world class beach front location. The Beaches lifestyle awaits you, where there is opportunity to move straight in or add value and your own personal touch to create the ultimate chic beach pad.
Total titled area - 93.8 sqm approx.
Water rates - $151 pq approx.
Council rates - $366 pq approx.
For further information or to arrange an inspection please call or email;
Matt Morley on 0418 168 932 and 9981 9416
matt@doylespillane.com.au
or
Stephen Murace on 0413 763 993 and 9981 9426
s.murace@doylespillane.com.au
"We have obtained all information in this document from sources we believe to be reliable; however, we cannot guarantee its accuracy. Prospective purchasers are advised to carry out their own investigations."
Property History for 6/149 Oaks Ave, Dee Why, NSW 2099
- 16 Mar 2022Sold for $1,402,000
- 23 Feb 2022Listed for Sale Auction | $1,350,000 bidding guide
- 10 Mar 2017Sold

Recent sales nearby
See more recent sales nearbySimilar properties For Sale nearby
See more properties for sale nearby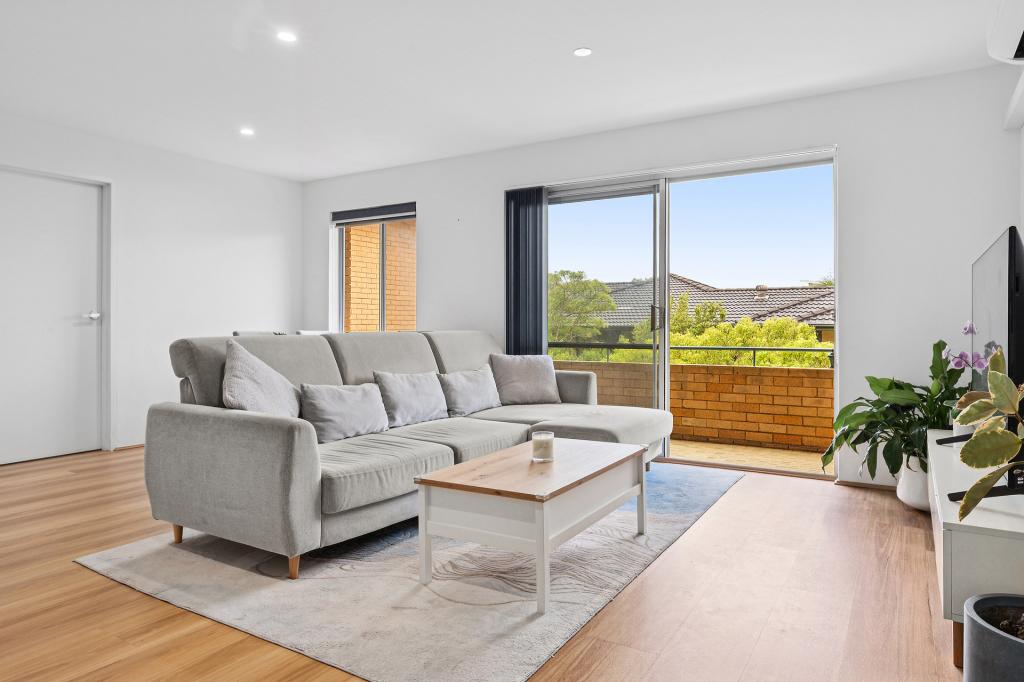 0
0
 0
0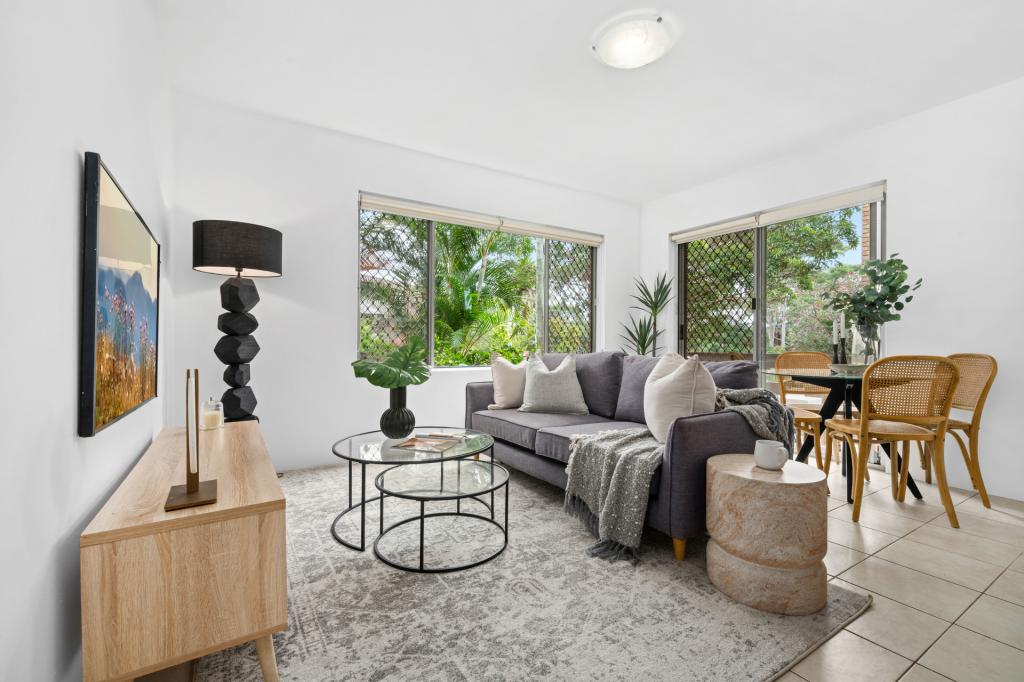 0
0
Similar properties For Rent nearby
See more properties for rent nearby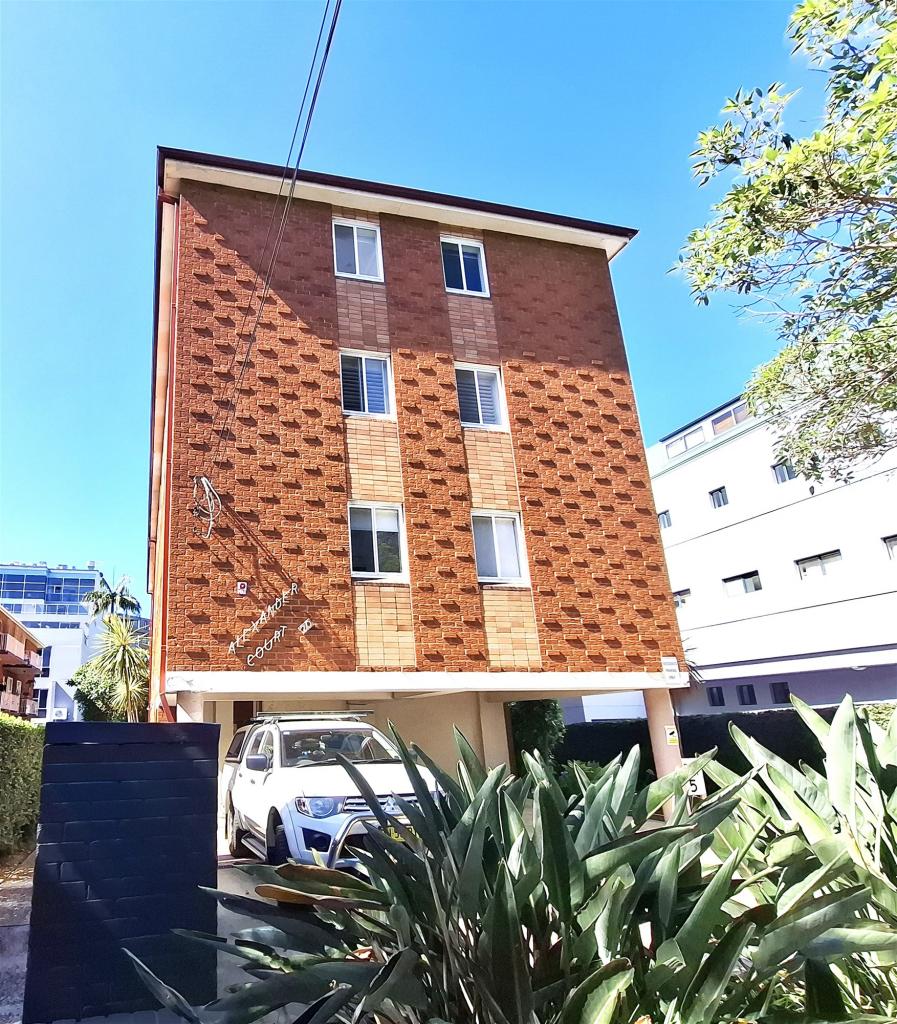 0
0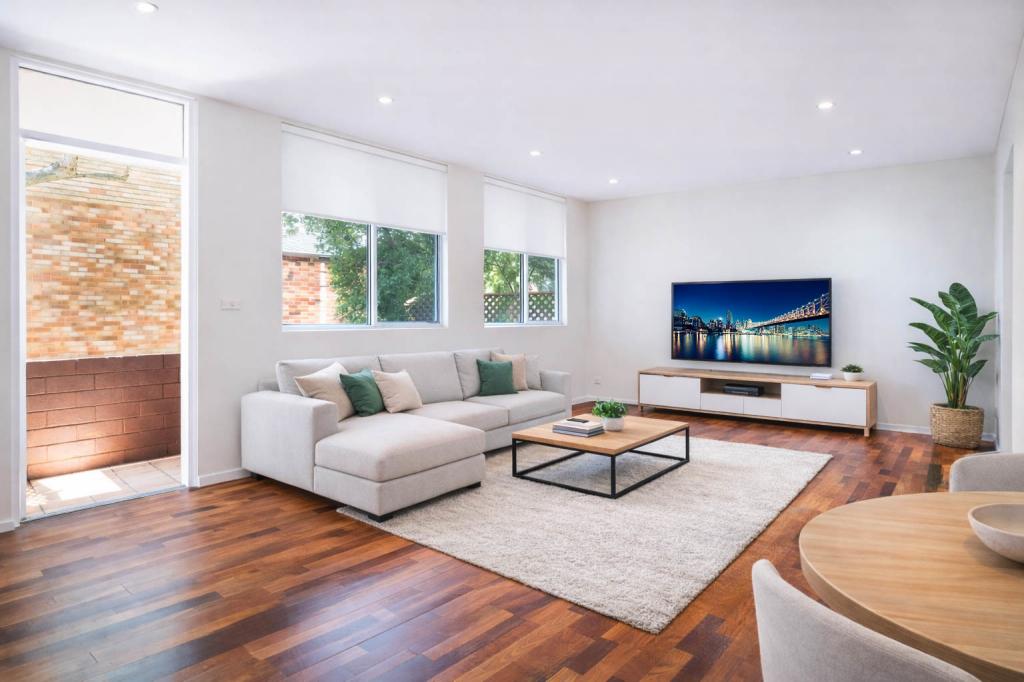 0
0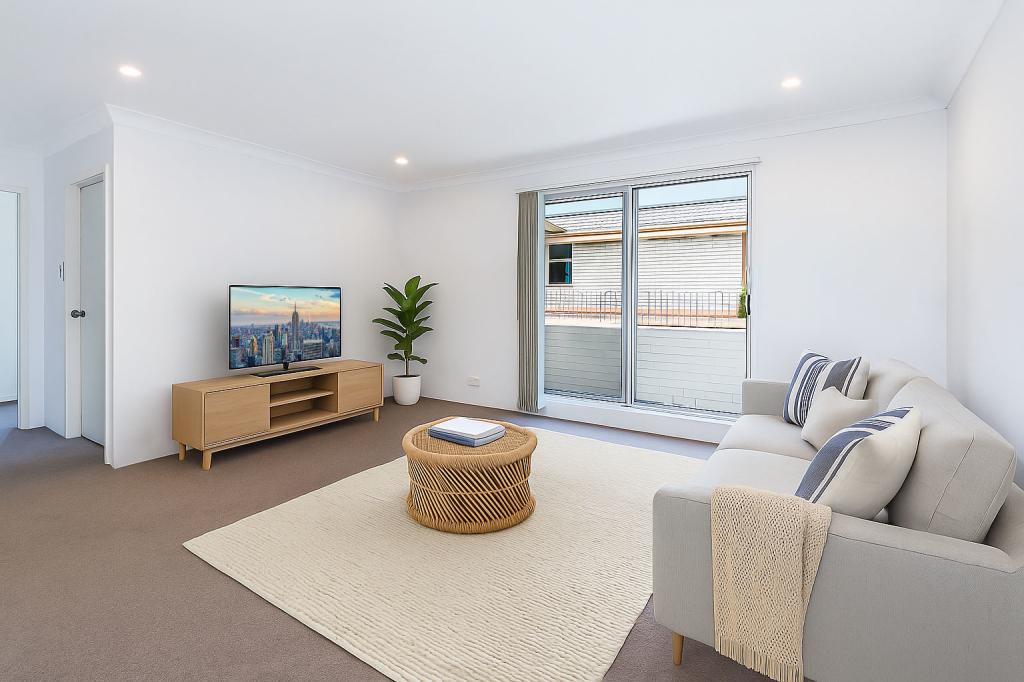 0
0
About Dee Why 2099
The size of Dee Why is approximately 3.4 square kilometres. It has 11 parks covering nearly 15.0% of total area. The population of Dee Why in 2016 was 21518 people. By 2021 the population was 23354 showing a population growth of 8.5% in the area during that time. The predominant age group in Dee Why is 30-39 years. Households in Dee Why are primarily childless couples and are likely to be repaying $1800 - $2399 per month on mortgage repayments. In general, people in Dee Why work in a professional occupation.In 2021, 50.20% of the homes in Dee Why were owner-occupied compared with 50.30% in 2016.
Dee Why has 13,230 properties. Over the last 5 years, Houses in Dee Why have seen a 25.54% increase in median value, while Units have seen a 26.09% increase. As at 31 March 2026:
- The median value for Houses in Dee Why is $2,835,669 while the median value for Units is $1,121,092.
- Houses have a median rent of $1,300 while Units have a median rent of $780.
Suburb Insights for Dee Why 2099
Market Insights
Dee Why Trends for Houses
N/A
N/A
View TrendN/A
N/A
Dee Why Trends for Units
N/A
N/A
View TrendN/A
N/A
Neighbourhood Insights
© Copyright 2026. RP Data Pty Ltd trading as Cotality (Cotality). All rights reserved. No reproduction, distribution, or transmission of the copyrighted materials is permitted. The information is deemed reliable but not guaranteed.
While Cotality uses commercially reasonable efforts to ensure the Cotality Data is current, Cotality does not warrant the accuracy, currency or completeness of the Cotality Data and to the full extent permitted by law excludes all loss or damage howsoever arising (including through negligence) in connection with the Cotality Data.
This product uses cookies and other similar technologies to improve and customise your browsing experience, to tailor content and adverts, and for analytics and metrics regarding visitor usage on this product and other media. We may share cookie and analytics information with third parties for the purposes of advertising. By continuing to use our website, you consent to cookies being used. View our Privacy Policy here.
X