
35 South Creek RoadDee Why NSW 2099
Property Details for 35 South Creek Rd, Dee Why
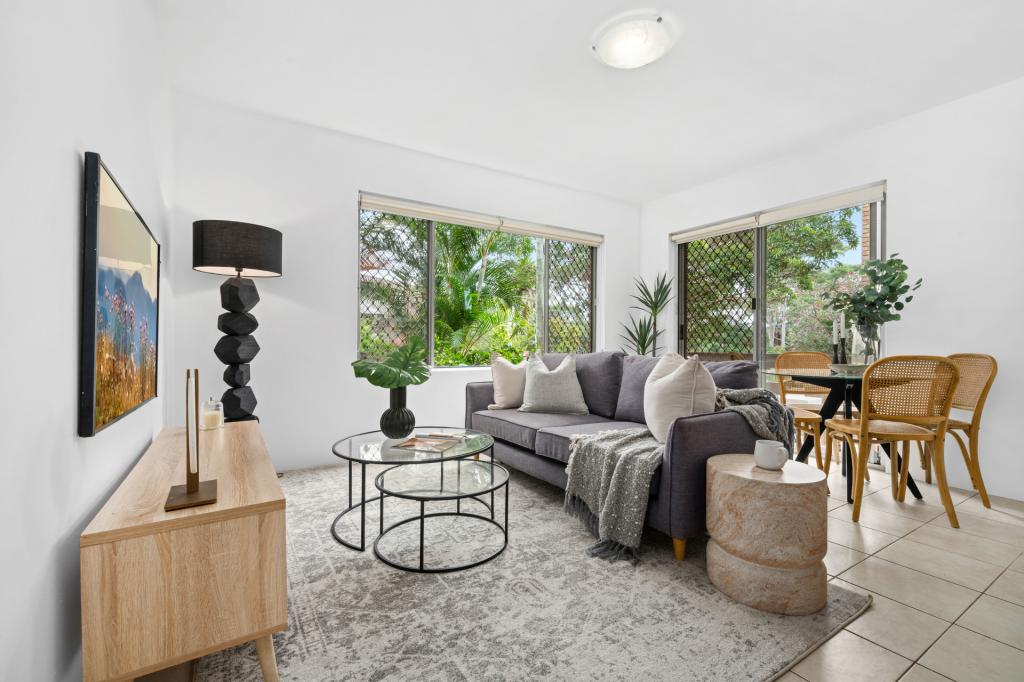
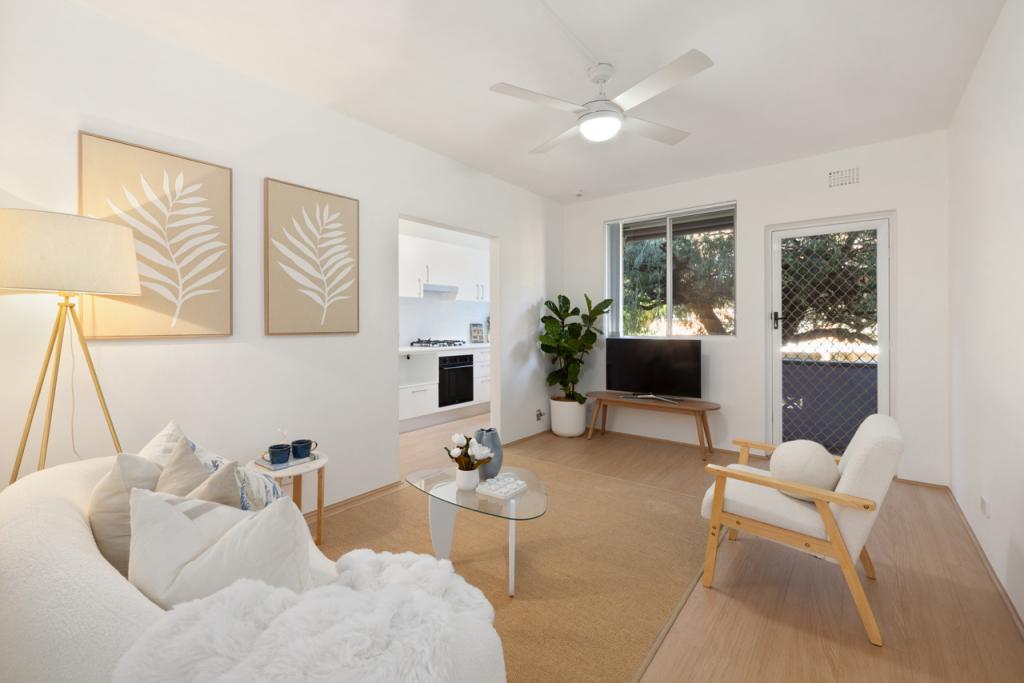
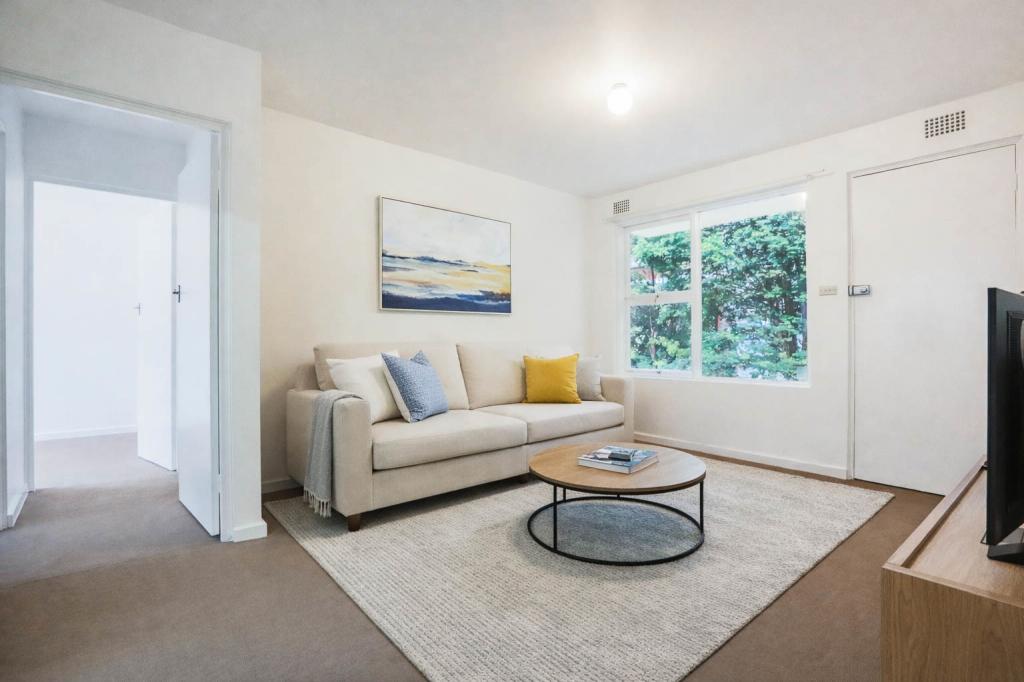
35 South Creek Rd, Dee Why is a 2 bedroom, 1 bathroom Unit with 1 parking spaces and was built in 2021. The property has a land size of 765m2 and floor size of 280m2. While the property is not currently for sale or for rent, it was last sold in August 2019.
Last Listing description (February 2026)
Spacious and as new, nestled at the rear of the property designed for peace and tranquility. Boasting space and all the modern expectations, including, internal laundry, dishwasher and air-conditioning. Modern gas kitchen , built-ins and stylish bathroom compliment this property, only a short stroll to shops, transport, beach and schools. Parking is on street.
Property History for 35 South Creek Rd, Dee Why, NSW 2099
- 27 Jan 2026Listed for Rent $745 / week
- 08 Sep 2022Listed for Rent $595 / week
- 17 Aug 2019Sold for $1,420,000

Recent sales nearby
See more recent sales nearbySimilar properties For Sale nearby
See more properties for sale nearby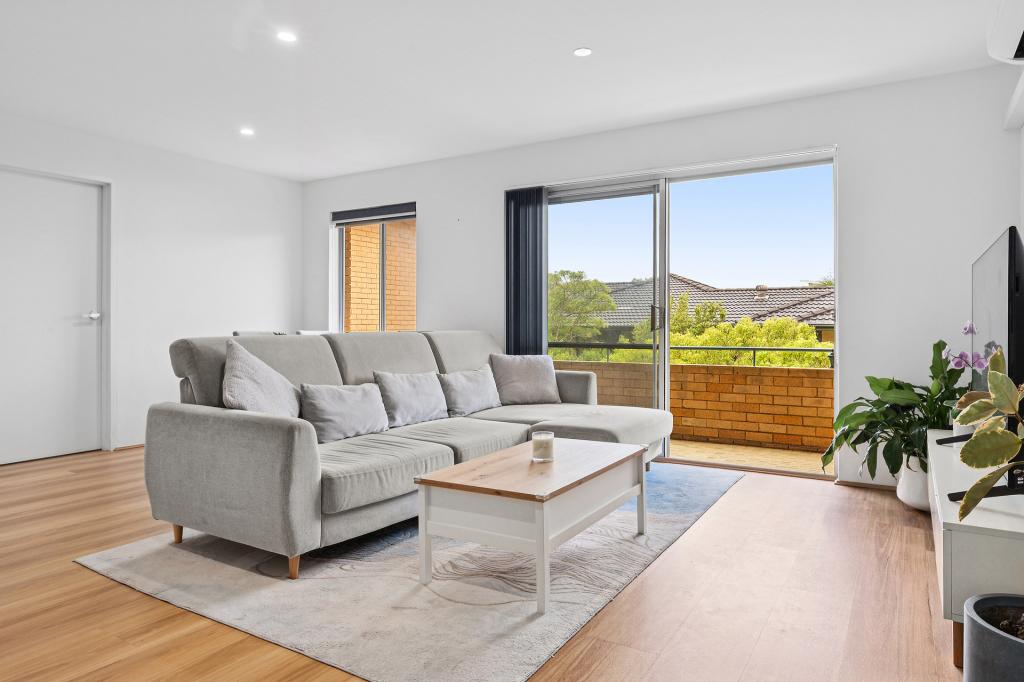 0
0
 0
0
 0
0Similar properties For Rent nearby
See more properties for rent nearby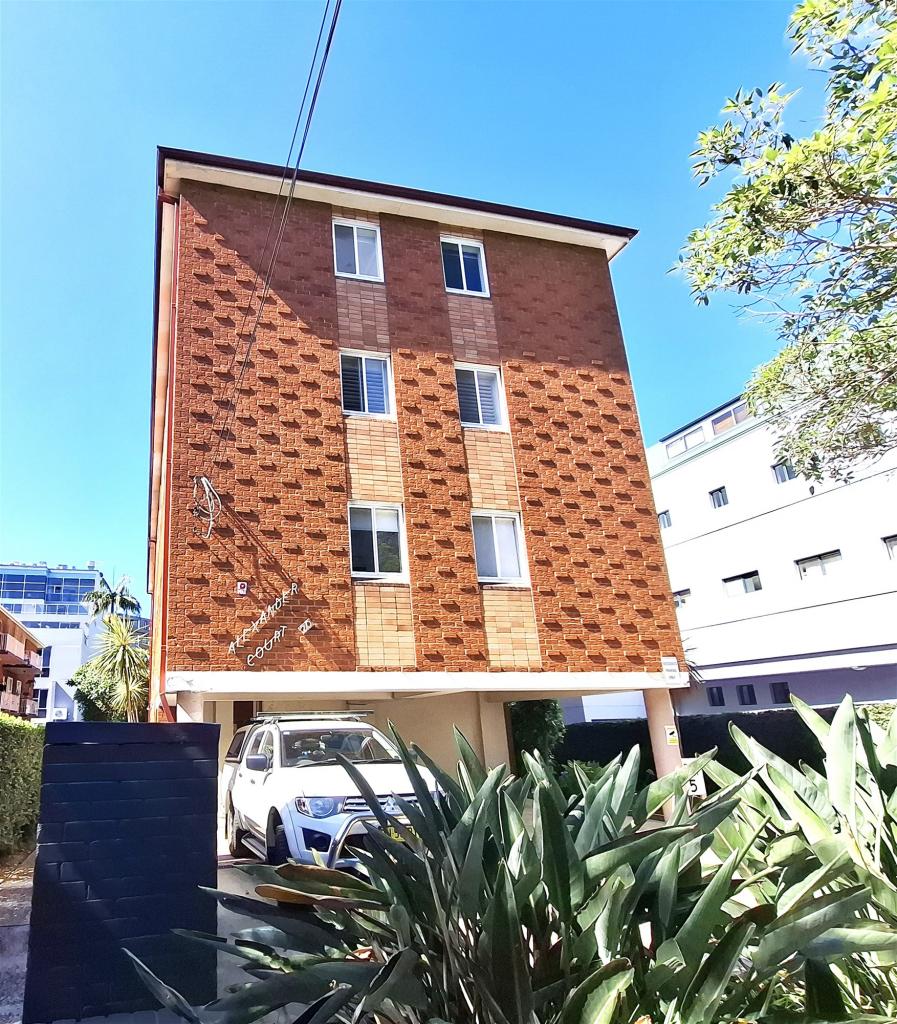 0
0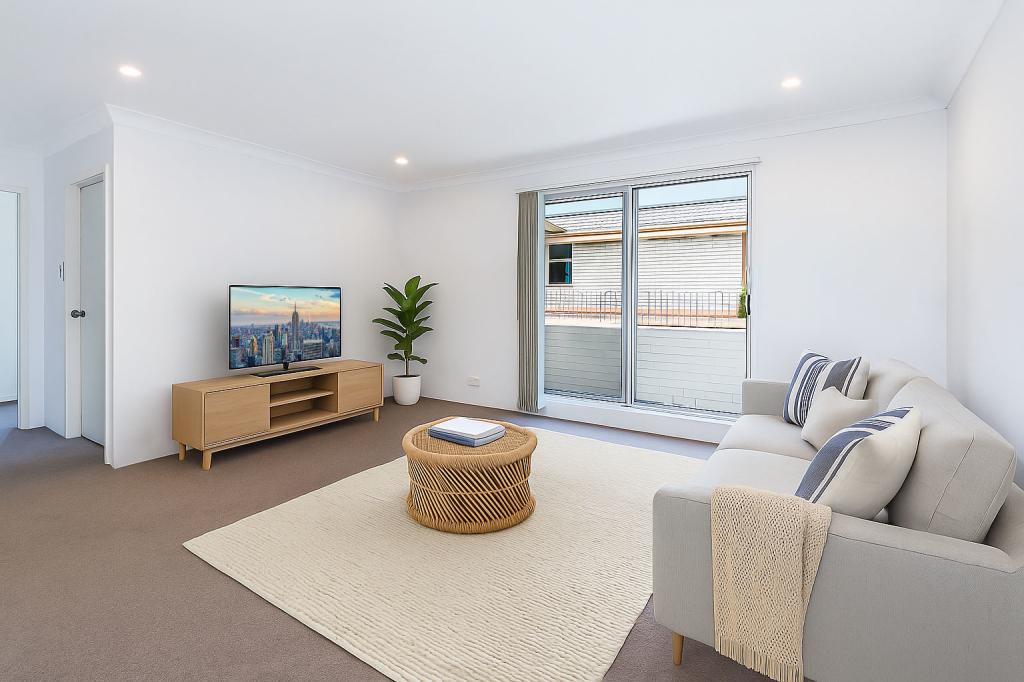 0
0
 0
0About Dee Why 2099
The size of Dee Why is approximately 3.4 square kilometres. It has 11 parks covering nearly 15.0% of total area. The population of Dee Why in 2016 was 21518 people. By 2021 the population was 23354 showing a population growth of 8.5% in the area during that time. The predominant age group in Dee Why is 30-39 years. Households in Dee Why are primarily childless couples and are likely to be repaying $1800 - $2399 per month on mortgage repayments. In general, people in Dee Why work in a professional occupation.In 2021, 50.20% of the homes in Dee Why were owner-occupied compared with 50.30% in 2016.
Dee Why has 13,232 properties. Over the last 5 years, Houses in Dee Why have seen a 25.54% increase in median value, while Units have seen a 26.09% increase. As at 31 March 2026:
- The median value for Houses in Dee Why is $2,835,669 while the median value for Units is $1,121,092.
- Houses have a median rent of $1,300 while Units have a median rent of $780.
Suburb Insights for Dee Why 2099
Market Insights
Dee Why Trends for Houses
N/A
N/A
View TrendN/A
N/A
Dee Why Trends for Units
N/A
N/A
View TrendN/A
N/A
Neighbourhood Insights
© Copyright 2026. RP Data Pty Ltd trading as Cotality (Cotality). All rights reserved. No reproduction, distribution, or transmission of the copyrighted materials is permitted. The information is deemed reliable but not guaranteed.
While Cotality uses commercially reasonable efforts to ensure the Cotality Data is current, Cotality does not warrant the accuracy, currency or completeness of the Cotality Data and to the full extent permitted by law excludes all loss or damage howsoever arising (including through negligence) in connection with the Cotality Data.
This product uses cookies and other similar technologies to improve and customise your browsing experience, to tailor content and adverts, and for analytics and metrics regarding visitor usage on this product and other media. We may share cookie and analytics information with third parties for the purposes of advertising. By continuing to use our website, you consent to cookies being used. View our Privacy Policy here.
X