
2/753 Pittwater RoadDee Why NSW 2099
Property Details for 2/753 Pittwater Rd, Dee Why
2/753 Pittwater Rd, Dee Why is a 2 bedroom, 1 bathroom Unit with 1 parking spaces and was built in 1970. The property has a land size of 74m2 and floor size of 53m2. While the property is not currently for sale or for rent, it was last sold in December 2024. There are other 2 bedroom Unit sold in Dee Why in the last 12 months.
Last Listing description (January 2025)
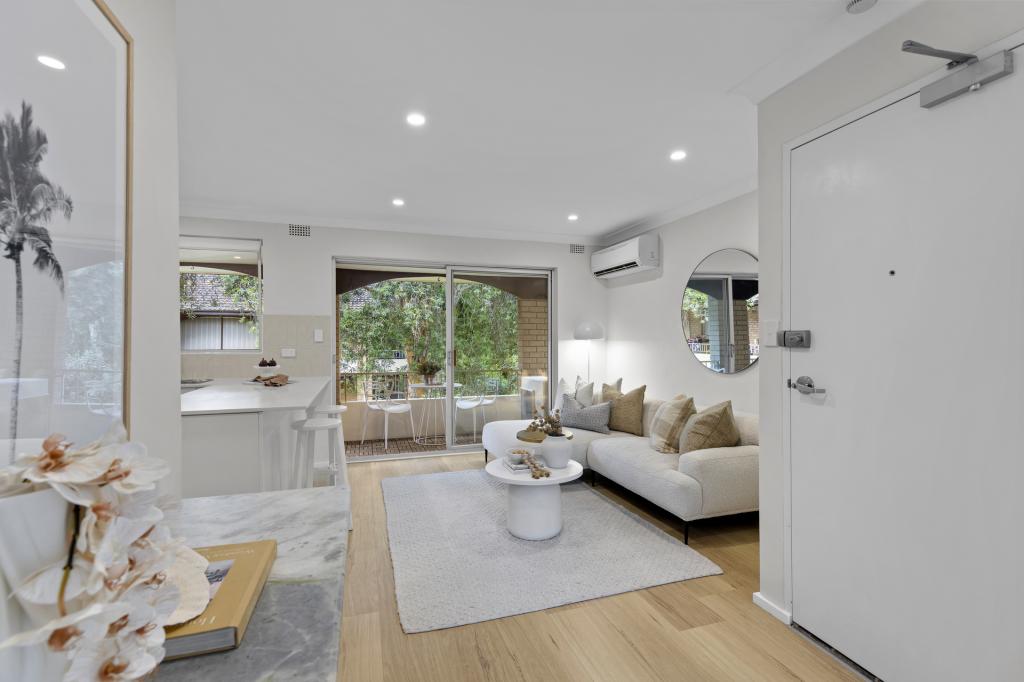
Perfectly positioned on the north east corner of the block, this renovated apartment is flooded with loads of natural light. The spacious living area flows seamlessly to the outdoor balcony. The modern kitchen offers electric cooktop, dishwasher and ample cupboard space.Ideal location within an easy level walk to the beach, rock pool, beach side eateries and cafes, lagoon, walking trails, parks, transport, restaurants, shops and Dee Why RSL. - Renovated north east facing, flooded with natural light- Spacious living area flow seamlessly to the outdoor balcony - Kitchen with electric cooktop, dishwasher & ample cupboard space - Two generous size bedrooms, main with mirrored built in wardrobes bathroom with separate bath, shower - Internal laundry off kitchen with washer/dryer included- Floorboards throughout, ceiling fan, storage cupboard - Ideal located with a level walk to shops, cafes, oval & B-line transport Water Rates: $172 per quarter (approx.)Council Rates: $425 per quarter (approx.)Strata Rates: $1,195 per quarter (approx.)
Property History for 2/753 Pittwater Rd, Dee Why, NSW 2099
- 09 Dec 2024Sold for $805,000
- 16 Oct 2024Listed for Sale SOLD - $805,000
- 03 Mar 2021Listed for Rent $550 / week

Recent sales nearby
See more recent sales nearbySimilar properties For Sale nearby
See more properties for sale nearby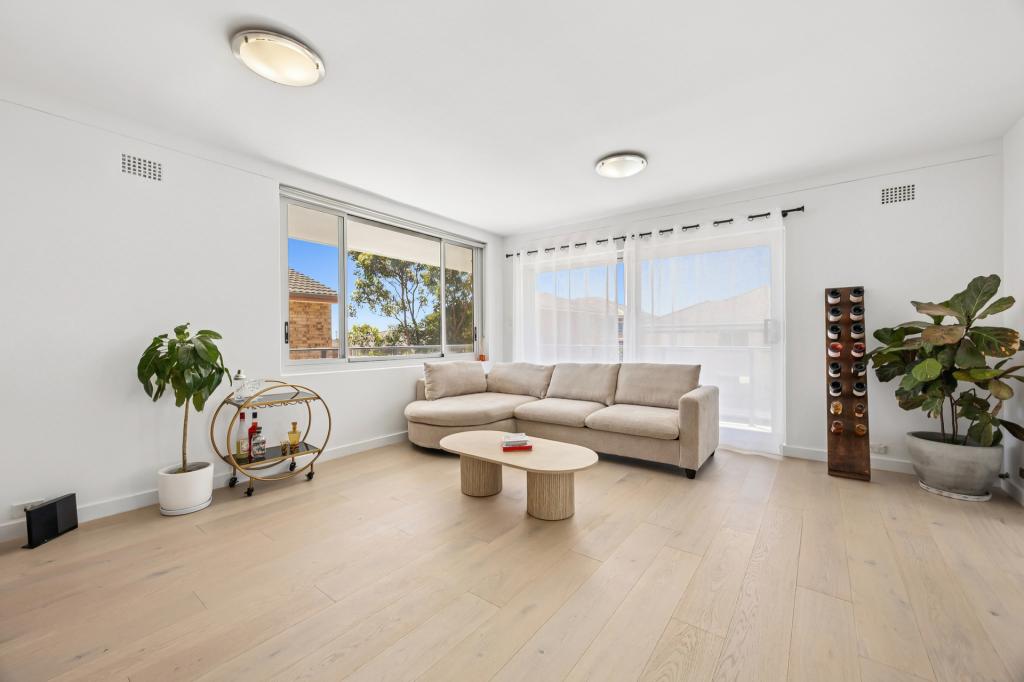 0
0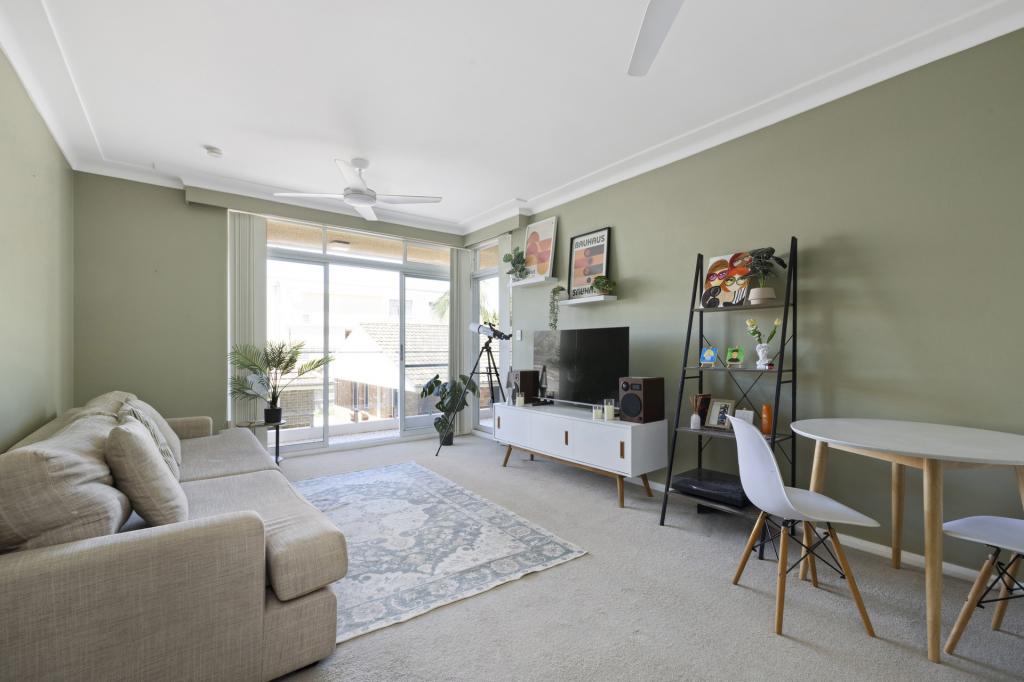 0
0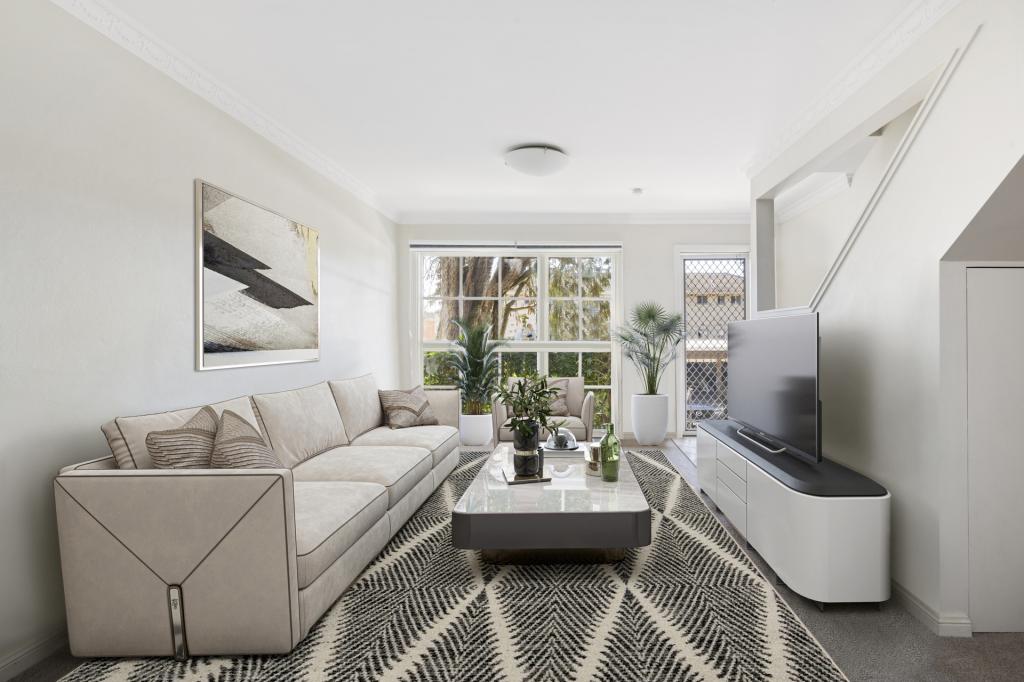 0
0Similar properties For Rent nearby
See more properties for rent nearby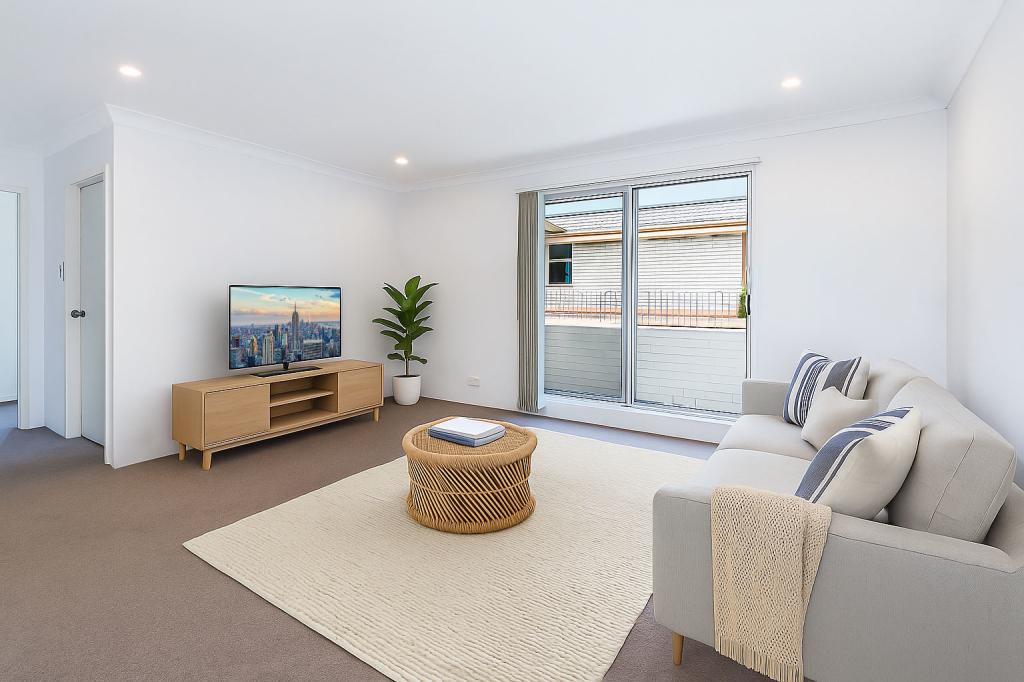 0
0
 0
0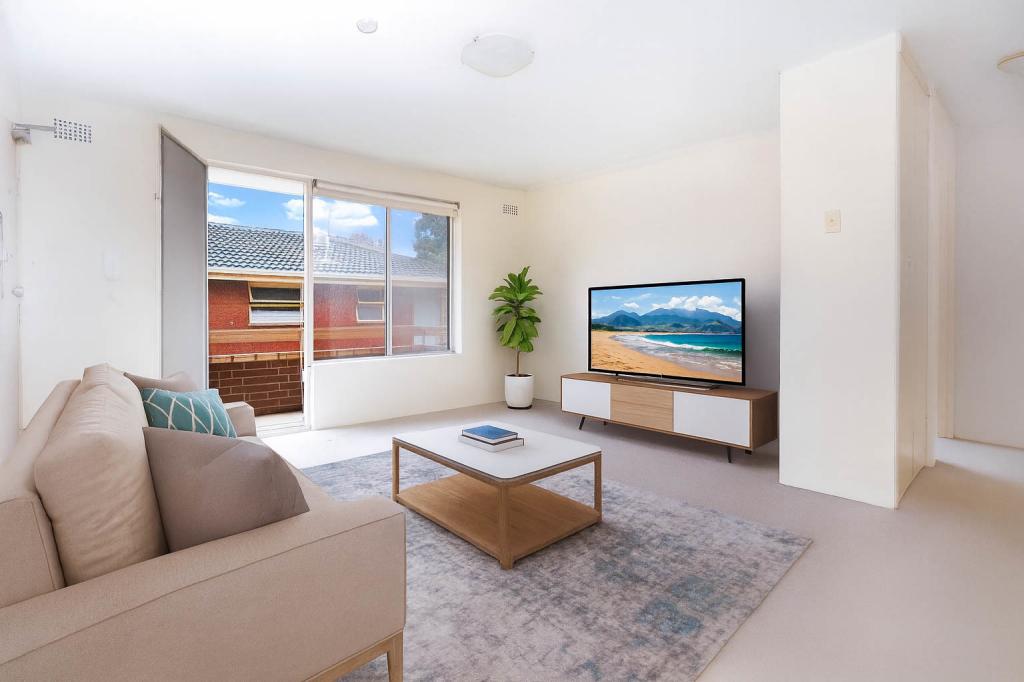 0
0About Dee Why 2099
The size of Dee Why is approximately 3.4 square kilometres. It has 11 parks covering nearly 15.0% of total area. The population of Dee Why in 2016 was 21518 people. By 2021 the population was 23354 showing a population growth of 8.5% in the area during that time. The predominant age group in Dee Why is 30-39 years. Households in Dee Why are primarily childless couples and are likely to be repaying $1800 - $2399 per month on mortgage repayments. In general, people in Dee Why work in a professional occupation.In 2021, 50.20% of the homes in Dee Why were owner-occupied compared with 50.30% in 2016.
Dee Why has 13,152 properties. Over the last 5 years, Houses in Dee Why have seen a 50.77% increase in median value, while Units have seen a 34.98% increase. As at 30 November 2025:
- The median value for Houses in Dee Why is $2,847,257 while the median value for Units is $1,100,000.
- Houses have a median rent of $780 while Units have a median rent of $750.
Suburb Insights for Dee Why 2099
Market Insights
Dee Why Trends for Houses
N/A
N/A
View TrendN/A
N/A
Dee Why Trends for Units
N/A
N/A
View TrendN/A
N/A
Neighbourhood Insights
© Copyright 2025. RP Data Pty Ltd trading as Cotality (Cotality). All rights reserved. No reproduction, distribution, or transmission of the copyrighted materials is permitted. The information is deemed reliable but not guaranteed.
While Cotality uses commercially reasonable efforts to ensure the Cotality Data is current, Cotality does not warrant the accuracy, currency or completeness of the Cotality Data and to the full extent permitted by law excludes all loss or damage howsoever arising (including through negligence) in connection with the Cotality Data.
This product uses cookies and other similar technologies to improve and customise your browsing experience, to tailor content and adverts, and for analytics and metrics regarding visitor usage on this product and other media. We may share cookie and analytics information with third parties for the purposes of advertising. By continuing to use our website, you consent to cookies being used. View our Privacy Policy here.
X