
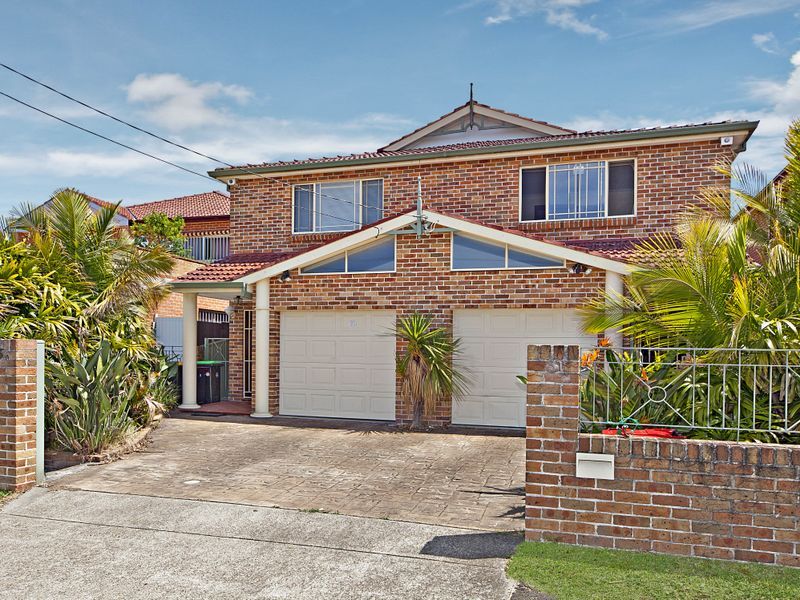
21 Thorncraft ParadeCampsie NSW 2194
Property Details for 21 Thorncraft Pde, Campsie
21 Thorncraft Pde, Campsie is a 3 bedroom, 1 bathroom House with 2 parking spaces and was built in 1920. The property has a land size of 270m2.
Last Listing description (October 2025)
This spacious full brick home is situated on a sunny corner block and only a short stroll to Campsie shopping centre, school, parks and train station.
It features:
* Three (3) sun-filled double sized bedrooms with built in wardrobes
* Separate eat-in kitchen, dining room & lounge room -
* Large bathroom
* Double lock up garage
* Low maintenance back yard with outdoor alfresco ideal for entertainers
Property History for 21 Thorncraft Pde, Campsie, NSW 2194
- 19 Sep 2025Listed for Rent $1,100 / week
- 06 Aug 2025Listed for Rent $1,200 / week
- 18 Jan 2023Listed for Rent - Price not available

Recent sales nearby
See more recent sales nearbySimilar properties For Sale nearby
See more properties for sale nearby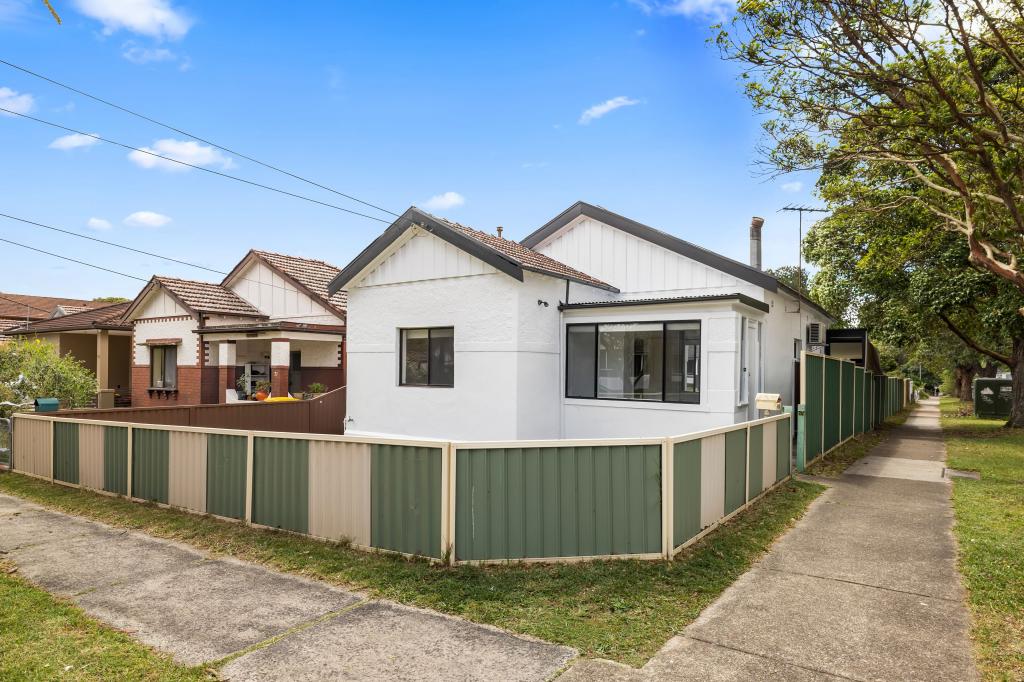 0
0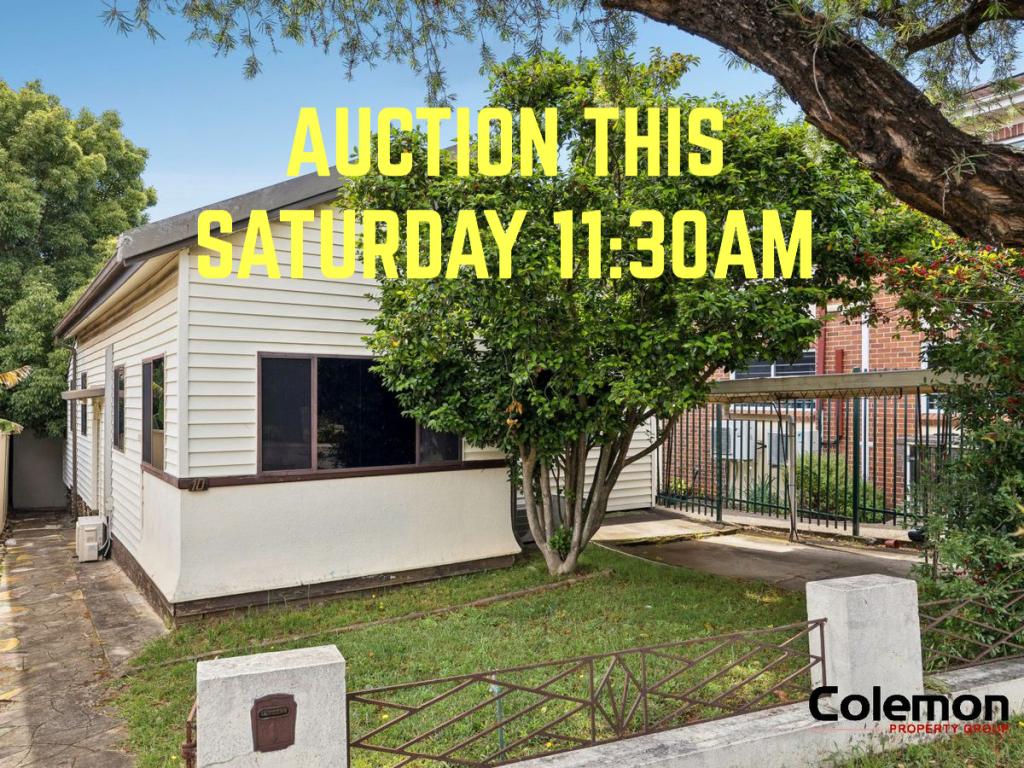 0
0 0
0Similar properties For Rent nearby
See more properties for rent nearby 0
0
 0
0 0
0About Campsie 2194
The size of Campsie is approximately 3.3 square kilometres. It has 16 parks covering nearly 3.3% of total area. The population of Campsie in 2016 was 24541 people. By 2021 the population was 26132 showing a population growth of 6.5% in the area during that time. The predominant age group in Campsie is 30-39 years. Households in Campsie are primarily couples with children and are likely to be repaying $1800 - $2399 per month on mortgage repayments. In general, people in Campsie work in a professional occupation.In 2021, 43.50% of the homes in Campsie were owner-occupied compared with 43.30% in 2016.
Campsie has 12,706 properties. Over the last 5 years, Houses in Campsie have seen a 68.23% increase in median value, while Units have seen a 24.86% increase. As at 30 November 2025:
- The median value for Houses in Campsie is $2,006,928 while the median value for Units is $705,502.
- Houses have a median rent of $660 while Units have a median rent of $600.
Suburb Insights for Campsie 2194
Market Insights
Campsie Trends for Houses
N/A
N/A
View TrendN/A
N/A
Campsie Trends for Units
N/A
N/A
View TrendN/A
N/A
Neighbourhood Insights
© Copyright 2025. RP Data Pty Ltd trading as Cotality (Cotality). All rights reserved. No reproduction, distribution, or transmission of the copyrighted materials is permitted. The information is deemed reliable but not guaranteed.
While Cotality uses commercially reasonable efforts to ensure the Cotality Data is current, Cotality does not warrant the accuracy, currency or completeness of the Cotality Data and to the full extent permitted by law excludes all loss or damage howsoever arising (including through negligence) in connection with the Cotality Data.
This product uses cookies and other similar technologies to improve and customise your browsing experience, to tailor content and adverts, and for analytics and metrics regarding visitor usage on this product and other media. We may share cookie and analytics information with third parties for the purposes of advertising. By continuing to use our website, you consent to cookies being used. View our Privacy Policy here.
X