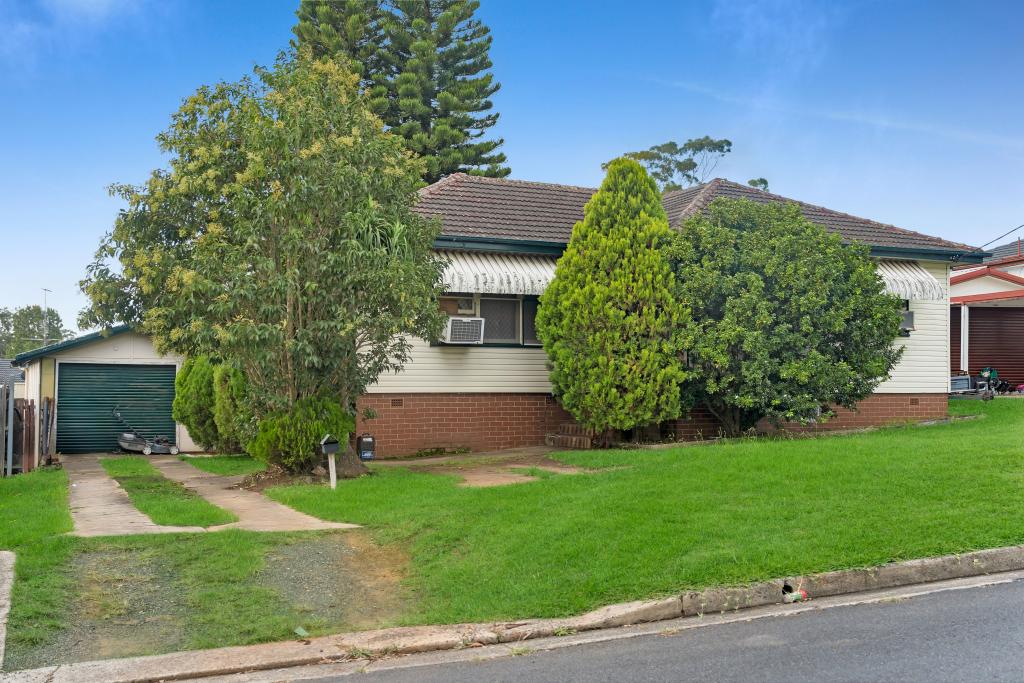
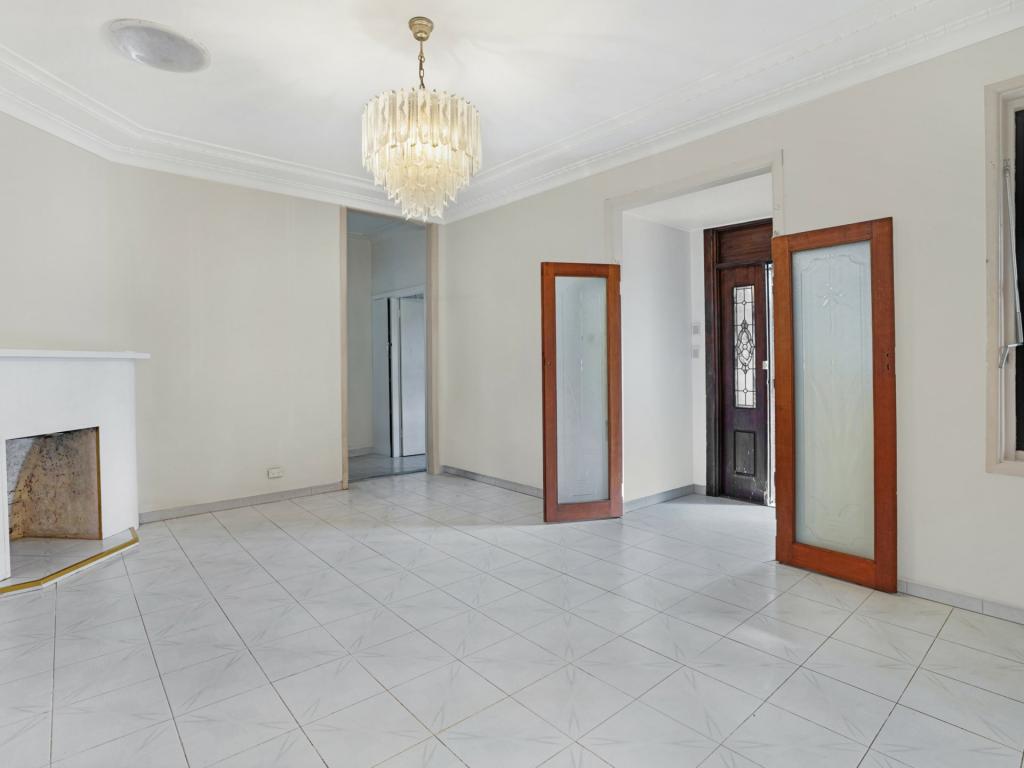
Harbord Rd, Campbelltown, NSW 2560 | Property Value & History | OnTheHouse
OFF MARKET
Are you the owner?

Harbord Road
Campbelltown NSW 2560

Bedrooms: -
Bathrooms: -
Car spaces: -
Floor area: 109m2
Land area: 1501m2
Estimated Value & Rent
Estimated Value
Estimated Rent
Low Confidence
Last updated 12 May 2025
Low

High
$1.00M
$1.10M
Save

Property Details for Harbord Rd, Campbelltown

Harbord Rd, Campbelltown is a bedroom, bathroom House. The property has a land size of 1501m2 and floor size of 109m2.

Building Type
House
Floor Size
109m2
Land Size
1501m2
Local Government
Campbelltown
Lot/Plan
403/DP43749

Property History for Harbord Rd, Campbelltown, NSW 2560

A timeline of how this property has performed in the market
    No history found for this property.

Commute Calculator

Where to?
-
-
-
-

About Campbelltown 2560

The size of Campbelltown is approximately 11.1 square kilometres. It has 29 parks covering nearly 11% of total area. The population of Campbelltown in 2011 was 10,400 people. By 2016 the population was 12,567 showing a population growth of 20.8% in the area during that time. The predominant age group in Campbelltown is 20-29 years. Households in Campbelltown are primarily couples with children and are likely to be repaying $1800 - $2399 per month on mortgage repayments. In general, people in Campbelltown work in a professional occupation. In 2011, 55.6% of the homes in Campbelltown were owner-occupied compared with 47.1% in 2016.

Campbelltown has 10,007 properties. Over the last 5 years, Houses in Campbelltown have seen a 57.96% increase in median value, while Units have seen a 19.22% increase. As at 30 April 2025:

  • The median value for Houses in Campbelltown is $931,136 while the median value for Units is $533,274.
  • Houses have a median rent of $560 while Units have a median rent of $520.
There are currently 54 properties listed for sale, and 102 properties listed for rent in Campbelltown on OnTheHouse. According to CoreLogic's data, 448 properties were sold in the past 12 months in Campbelltown.

What's around Harbord Rd, Campbelltown

Harbord Rd, Campbelltown is in the school catchment zone for Campbelltown Performing Arts High School and Campbelltown North Public School.

Nearby Schools
Comparable Properties
Leumeah Public School
1.2km
Leumeah 2560
PrimaryGovernmentP - 6Combined618 Enrolled
Campbelltown Performing Arts High School
1.32km
Campbelltown 2560
IN CATCHMENTSecondaryGovernment7 - 12Combined1091 Enrolled
Campbelltown North Public School
1.37km
Campbelltown 2560
IN CATCHMENTPrimaryGovernmentP - 6Combined360 Enrolled
Lomandra School
1.44km
Campbelltown 2560
SpecialGovernmentCombined62 Enrolled
Beverley Park School
1.48km
Campbelltown 2560
SpecialGovernmentCombined55 Enrolled
St Mary's Catholic Primary School
1.55km
458 MAIN RD Noraville 2263
PrimaryNon-Government1 - 6Combined496 Enrolled
St Mary's Catholic Primary School
1.55km
Eagle Vale 2558
PrimaryNon-GovernmentP - 6Combined192 Enrolled
Mary Immaculate Catholic Primary School
1.55km
Eagle Vale 2558
PrimaryNon-GovernmentP - 6Combined439 Enrolled
Claymore Public School
1.68km
Claymore 2559
PrimaryGovernmentP - 6Combined284 Enrolled
Odyssey House, Progressive Learning Centre
1.97km
Eagle Vale 2558
SpecialNon-Government10 - 10Combined88 Enrolled

Suburb Insights for Campbelltown 2560

Market Insights
Campbelltown Trends for Houses
Median Value

$931k

5.68%
View Trend
Median Growth

6.88%

View Trend
Median Rent

$560/W

5.66%
View Trend
Rental Yield

3.58%

1.70%
View Trend
Median Value: The middle value of all properties across the geography based on the Automated Valuation Model.


Median Value over 1 year (05/24 - 04/25)
Campbelltown Trends for Units
Median Value

$533k

3.89%
View Trend
Median Growth

3.74%

View Trend
Median Rent

$520/W

8.33%
View Trend
Rental Yield

5.10%

2.82%
View Trend
Median Value: The middle value of all properties across the geography based on the Automated Valuation Model.


Median Value over 1 year (05/24 - 04/25)
Neighbourhood Insights
Age

Population 12,567

0-9


13%

10-19


10%

20-29


17%

30-39


16%

40-49


11%

50-59


10%

60-69


10%

70-79


8%

80-89


5%

90-99


1%

Household Structure
Occupancy
Disclaimer
Whilst all reasonable effort is made to ensure the information in this publication is current, CoreLogic does not warrant the accuracy or completeness of the data and information contained in this publication and to the full extent not prohibited by law excludes all liability for any loss or damage arising in connection with the data and information contained in this publication.
New South Wales data
Contains property sales information provided under licence from the Valuer General New South Wales. RP Data Pty Ltd trading as CoreLogic Asia Pacific is authorised as a Property Sales Information provider by the Valuer General New South Wales.
Valuations and Estimates
This estimate is provided by CoreLogic, and is based on statistical market data such as recent local sales, property size, number of bedrooms and many more factors. It comes from public data, which may be incomplete or inaccurate, and should not be used in lieu of a professional appraisal under any circumstances, including for lending purposes or in home loan applications.
School data and Content
Product Data licenced by CoreLogic under a Creative Commons Attribution licence. For details regarding licence, data source, copyright and disclaimers, see https://www.corelogic.com.au/legals/third-party-restrictions
ABS data
This publication contains data and statistics provided by the Australian Bureau of Statistics, available at http://www.abs.gov.au/ and reproduced under Creative Commons Attribution 2.5 http://creativecommons.org/licenses/by/2.5/au/legalcode
Liveability information
The Liveability Score is a rating (out of 10) provided by Propella.ai Pty Ltd as a guide about how "well-connected" properties are in certain local areas. The Liveability Score is based on statistical data about a local area in which a property is located including the distance to and number of available facilities and services (including schools, parklands, health services, shopping and public transport) (Liveability Data). The Liveability Data and Liveability Score has not been verified or confirmed by CoreLogic, is not available for all properties, and is of a general nature and should not be construed as specific advice or relied upon in lieu of appropriate professional advice. Given the relative nature of the Liveability Score, propella.ai anticipate that scores for individual properties will change over time.
BESbswy