
29 Tudor StreetBelmore NSW 2192
Property Details for 29 Tudor St, Belmore
29 Tudor St, Belmore is a 2 bedroom, 1 bathroom Unit with 1 parking spaces and was built in 1960. The property has a land size of 590m2 and floor size of 68m2. While the property is not currently for sale or for rent, it was last sold in July 1994.
Last Listing description (May 2019)
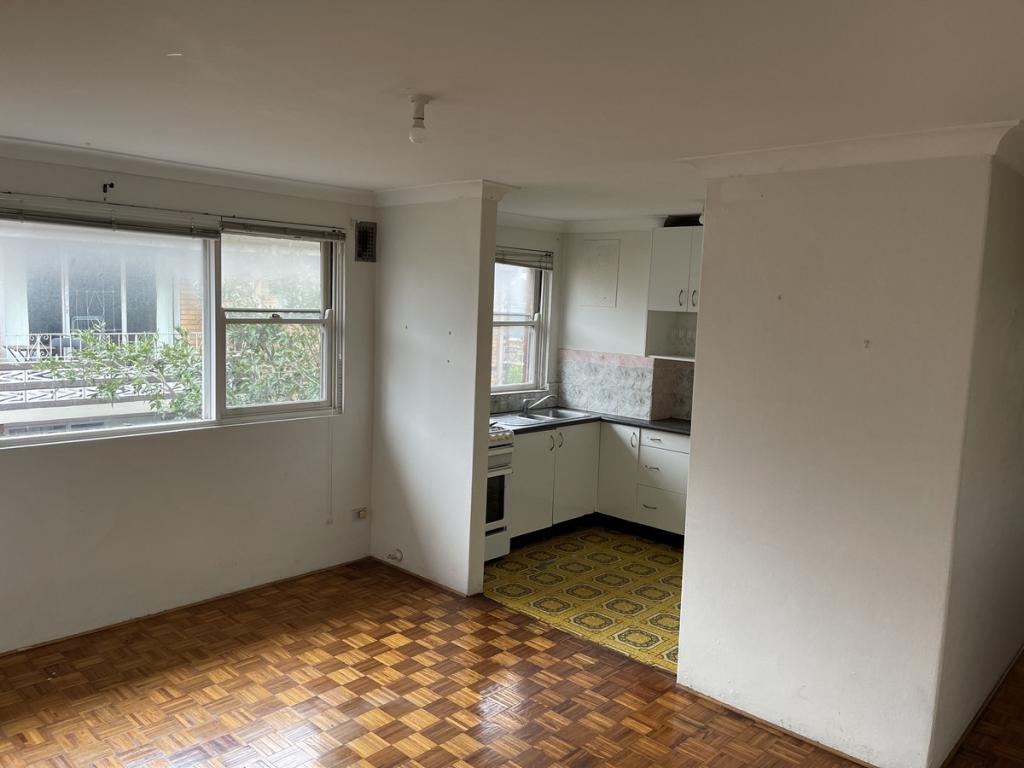
This fully renovated 2 bedroom unit located in Belmore features the following:
- Polished timber floorboards throughout
- Built ins for all bedrooms
- Modern bathroom
- Internal laundry
- Large private entertainment area
- Car space
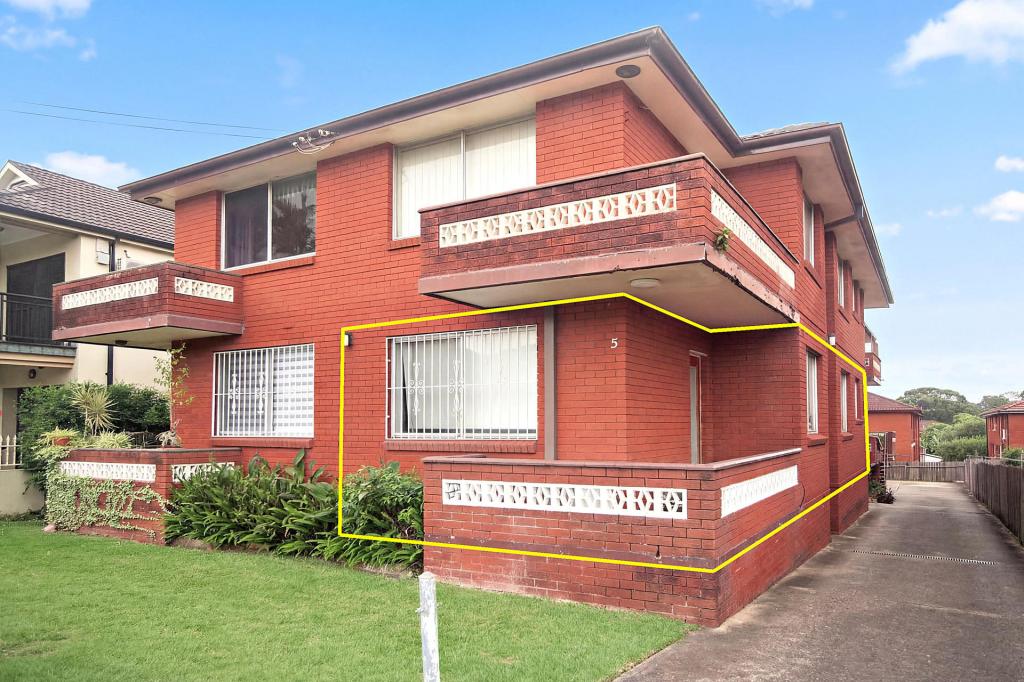
ADDRESS: 1/29 Tudor St, Belmore
INSPECT: Thursday 23rd May at 4:15-4:25pm OR By Appointment (02) 9759 1300
Property History for 29 Tudor St, Belmore, NSW 2192
- 20 May 2019Listed for Rent $450 / week
- 28 Jun 2013Listed for Rent - Price not available
- 17 Nov 2010Listed for Rent - Price not available

Recent sales nearby
See more recent sales nearbySimilar properties For Sale nearby
See more properties for sale nearby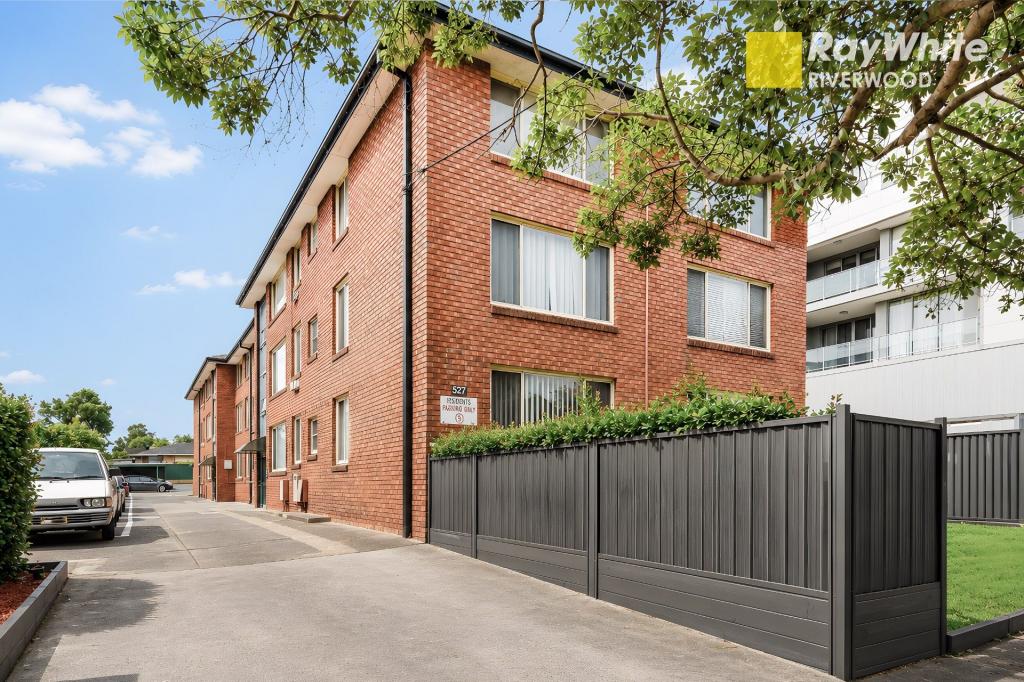 0
0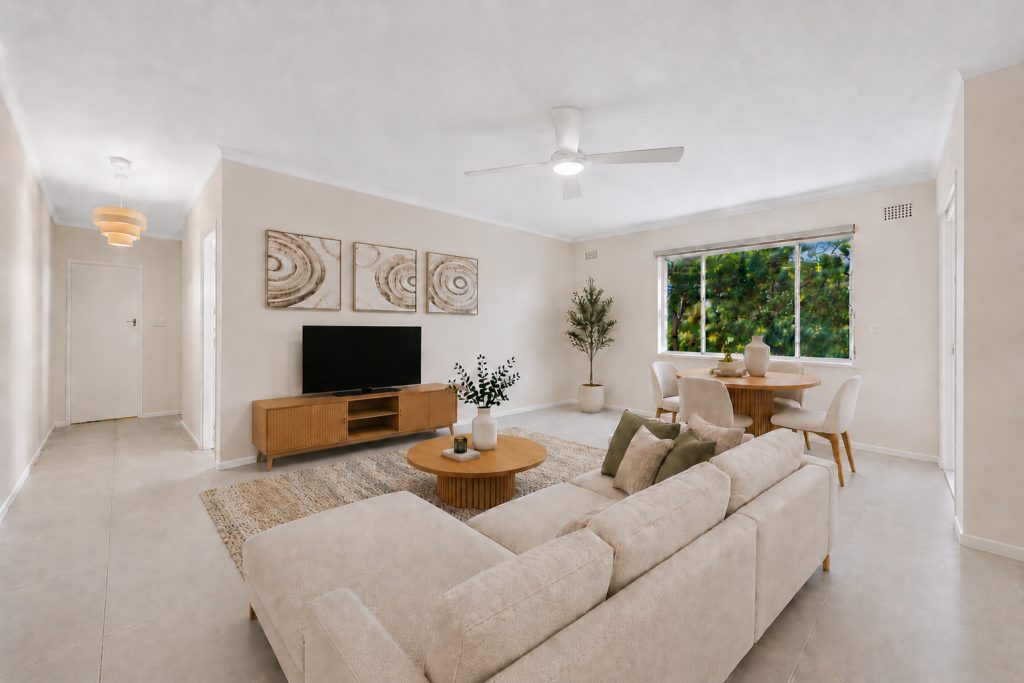 0
0
 0
0
Similar properties For Rent nearby
See more properties for rent nearby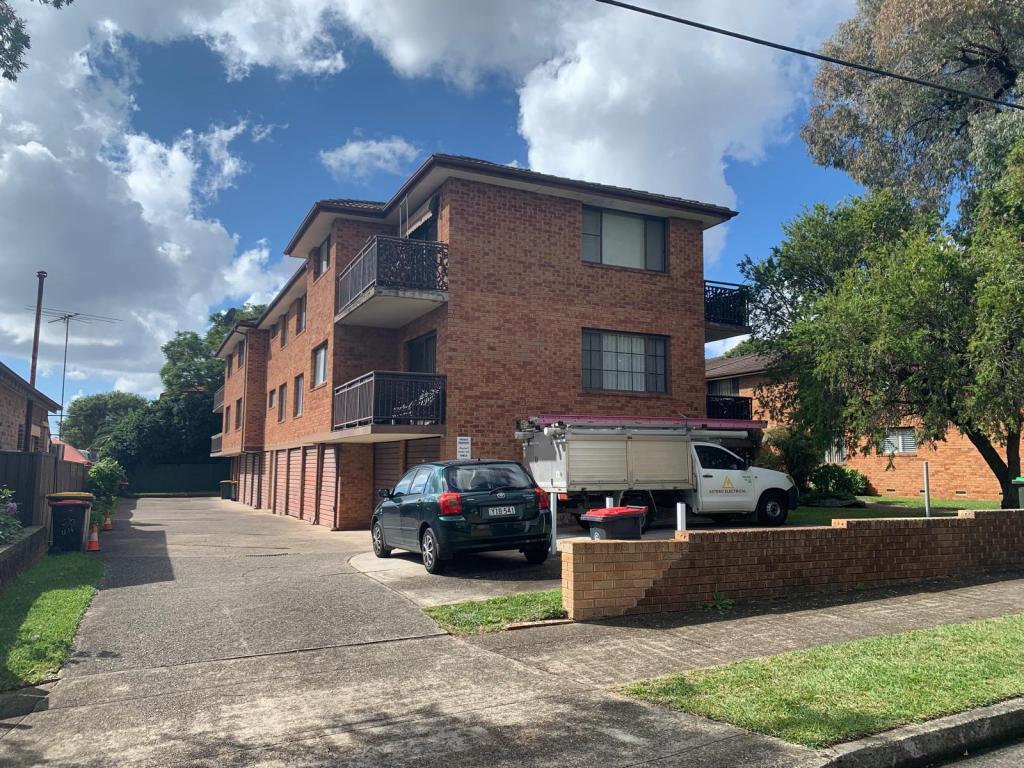 0
0
 0
0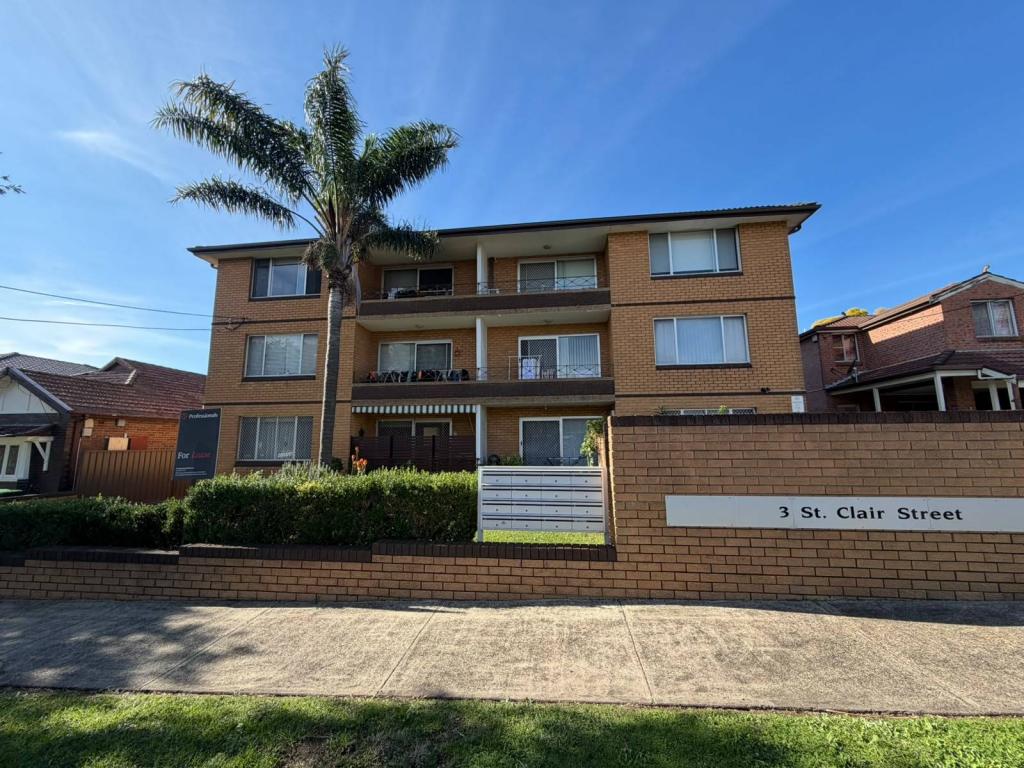 0
0About Belmore 2192
The size of Belmore is approximately 2.8 square kilometres. There are 12 parks, covering nearly 4.9% of the total area. The population of Belmore in 2016 was 12718 people. By 2021 the population was 13781 showing a population growth of 8.4% in the area during that time. The predominant age group in Belmore is 30-39 years. Households in Belmore are primarily couples with children and are likely to be repaying $1800 - $2399 per month on mortgage repayments. In general, people in Belmore work in a professional occupation.In 2021, 52.90% of the homes in Belmore were owner-occupied compared with 52.90% in 2016.
Belmore has 6,603 properties. Over the last 5 years, Houses in Belmore have seen a 36.79% increase in median value, while Units have seen a 26.10% increase. As at 31 May 2026:
- The median value for Houses in Belmore is $1,766,597 while the median value for Units is $708,574.
- Houses have a median rent of $890 while Units have a median rent of $580.
Suburb Insights for Belmore 2192
Market Insights
Belmore Trends for Houses
N/A
N/A
View TrendN/A
N/A
Belmore Trends for Units
N/A
N/A
View TrendN/A
N/A
Neighbourhood Insights
© Copyright 2026. RP Data Pty Ltd trading as Cotality (Cotality). All rights reserved. No reproduction, distribution, or transmission of the copyrighted materials is permitted. The information is deemed reliable but not guaranteed.
While Cotality uses commercially reasonable efforts to ensure the Cotality Data is current, Cotality does not warrant the accuracy, currency or completeness of the Cotality Data and to the full extent permitted by law excludes all loss or damage howsoever arising (including through negligence) in connection with the Cotality Data.
This product uses cookies and other similar technologies to improve and customise your browsing experience, to tailor content and adverts, and for analytics and metrics regarding visitor usage on this product and other media. We may share cookie and analytics information with third parties for the purposes of advertising. By continuing to use our website, you consent to cookies being used. View our Privacy Policy here.
X