
2 Montford CrescentLyneham ACT 2602
Property Details for 2 Montford Cres, Lyneham
Last Listing description (November 2017)
Unit 2 of 2 Montford Crescent Lyneham is a Single ground level 67m2 unit located in the North Lyneham shopping centre just 4.5km from the CBD.
This property represents an exciting opportunity for an owner occupier or investor to take control of this exceptional property and offers a unique opportunity to purchase in a much sought after location. The property will be sold via an Private Treaty sale process.
The property has the following primary attributes:
Opportunity to own property 5 minutes drive from the CBD
2 off street car parks (unallocated)
Prime location amongst North Lyneham shops
Updated fit out within
Free on street parking at Centre
The building will be a highly sought building due to its proximity to the CBD and quality of internal fitout.
The building is for Sale via Private Treaty
Property History for 2 Montford Cres, Lyneham, ACT 2602
- 18 Apr 2017Listed for Sale Not Disclosed
Recent sales nearby
See more recent sales nearby

Similar properties For Sale nearby
See more properties for sale nearby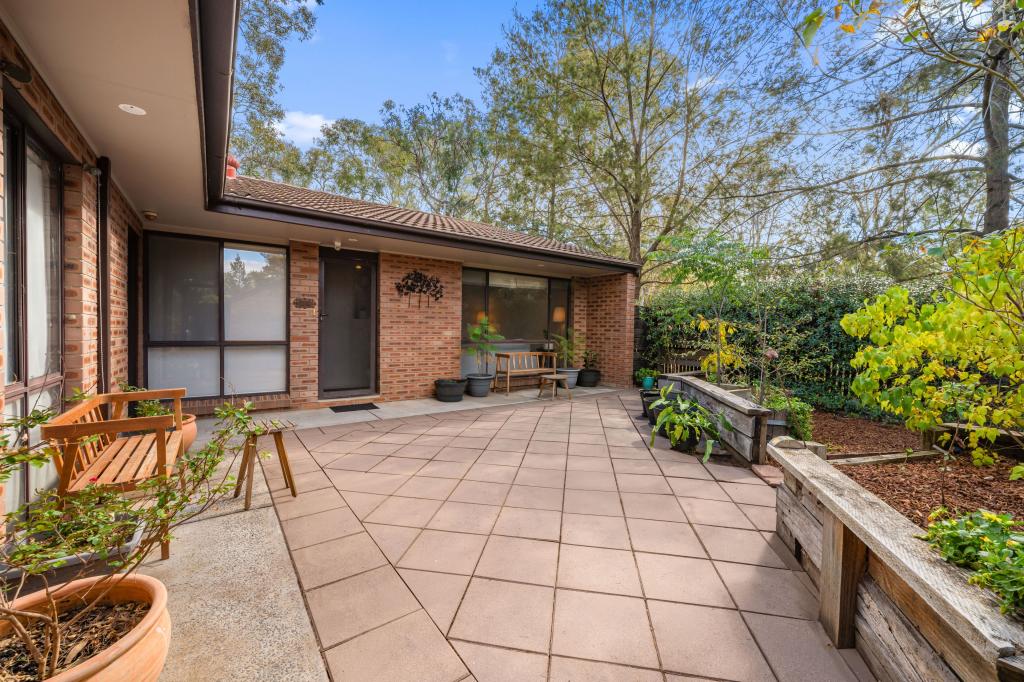 0
0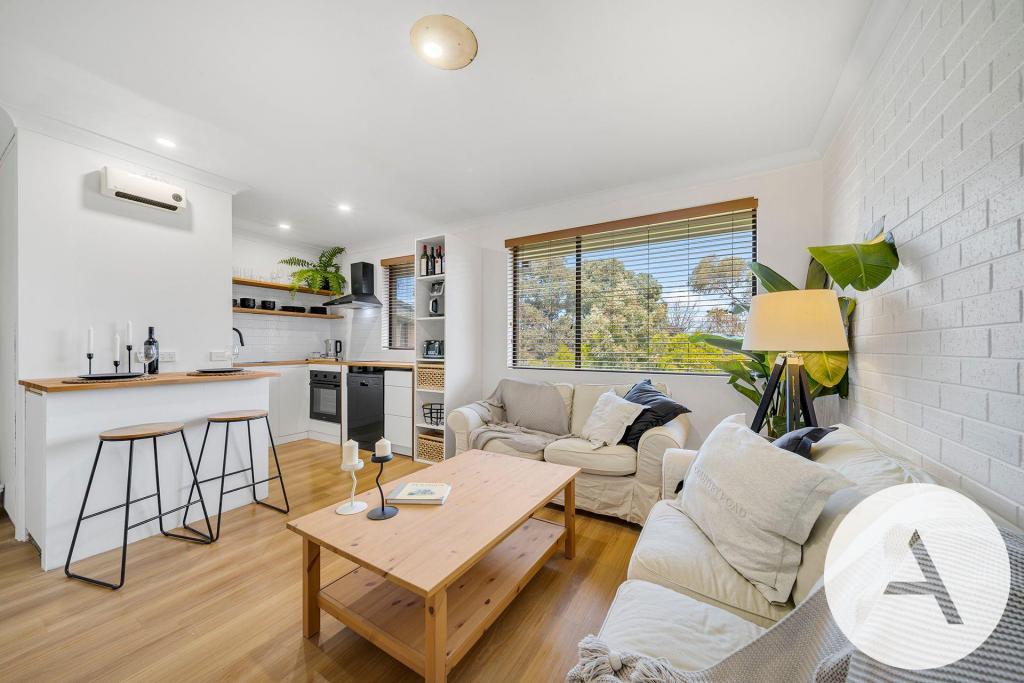 0
0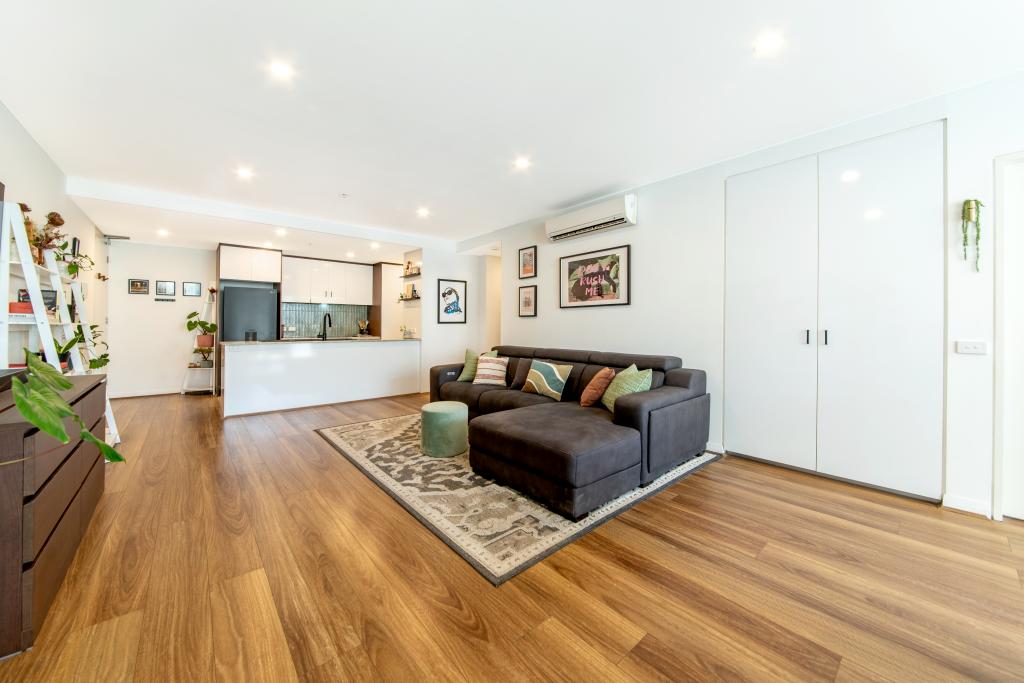 0
0Similar properties For Rent nearby
See more properties for rent nearby 0
0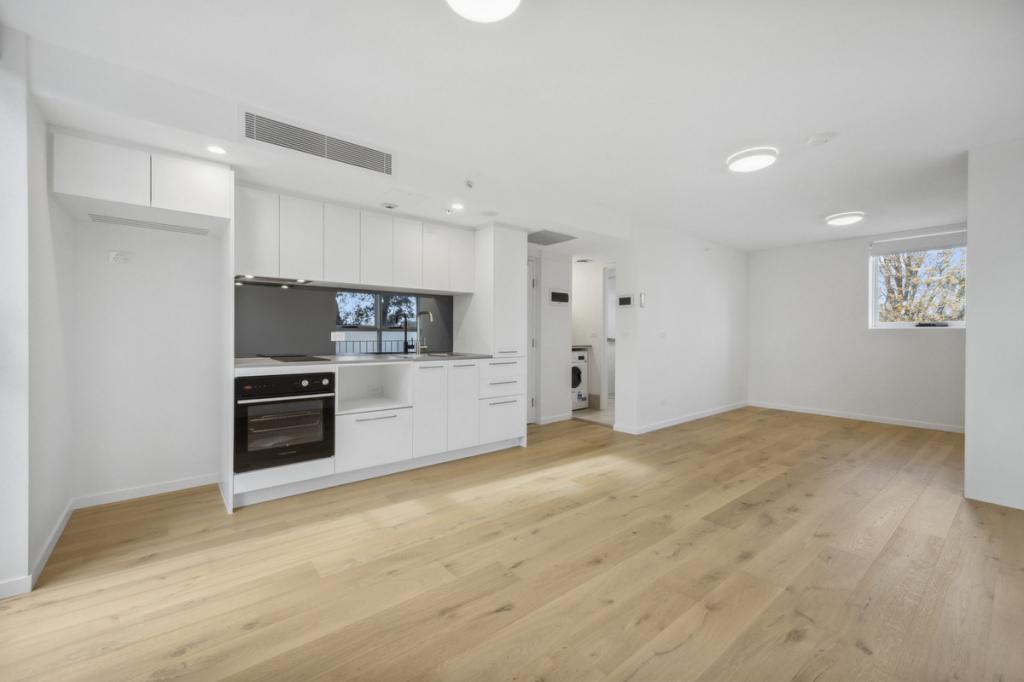 0
0 0
0About Lyneham 2602
The size of Lyneham is approximately 5.4 square kilometres. There are 17 parks, covering nearly 52.3% of the total area. The population of Lyneham in 2016 was 5112 people. By 2021 the population was 5703 showing a population growth of 11.6% in the area during that time. The predominant age group in Lyneham is 20-29 years. Households in Lyneham are primarily childless couples and are likely to be repaying $1800 - $2399 per month on mortgage repayments. In general, people in Lyneham work in a professional occupation.In 2021, 48.90% of the homes in Lyneham were owner-occupied compared with 41.80% in 2016.
Lyneham has 3,336 properties. Over the last 5 years, Houses in Lyneham have seen a 13.84% increase in median value, while Units have seen a 17.34% increase. As at 30 June 2026:
- The median value for Houses in Lyneham is $1,244,357 while the median value for Units is $531,273.
- Houses have a median rent of $690 while Units have a median rent of $580.
Suburb Insights for Lyneham 2602
Market Insights
Lyneham Trends for Houses
N/A
N/A
View TrendN/A
N/A
Lyneham Trends for Units
N/A
N/A
View TrendN/A
N/A
Neighbourhood Insights
© Copyright 2026. RP Data Pty Ltd trading as Cotality (Cotality). All rights reserved. No reproduction, distribution, or transmission of the copyrighted materials is permitted. The information is deemed reliable but not guaranteed.
While Cotality uses commercially reasonable efforts to ensure the Cotality Data is current, Cotality does not warrant the accuracy, currency or completeness of the Cotality Data and to the full extent permitted by law excludes all loss or damage howsoever arising (including through negligence) in connection with the Cotality Data.
This product uses cookies and other similar technologies to improve and customise your browsing experience, to tailor content and adverts, and for analytics and metrics regarding visitor usage on this product and other media. We may share cookie and analytics information with third parties for the purposes of advertising. By continuing to use our website, you consent to cookies being used. View our Privacy Policy here.
X