
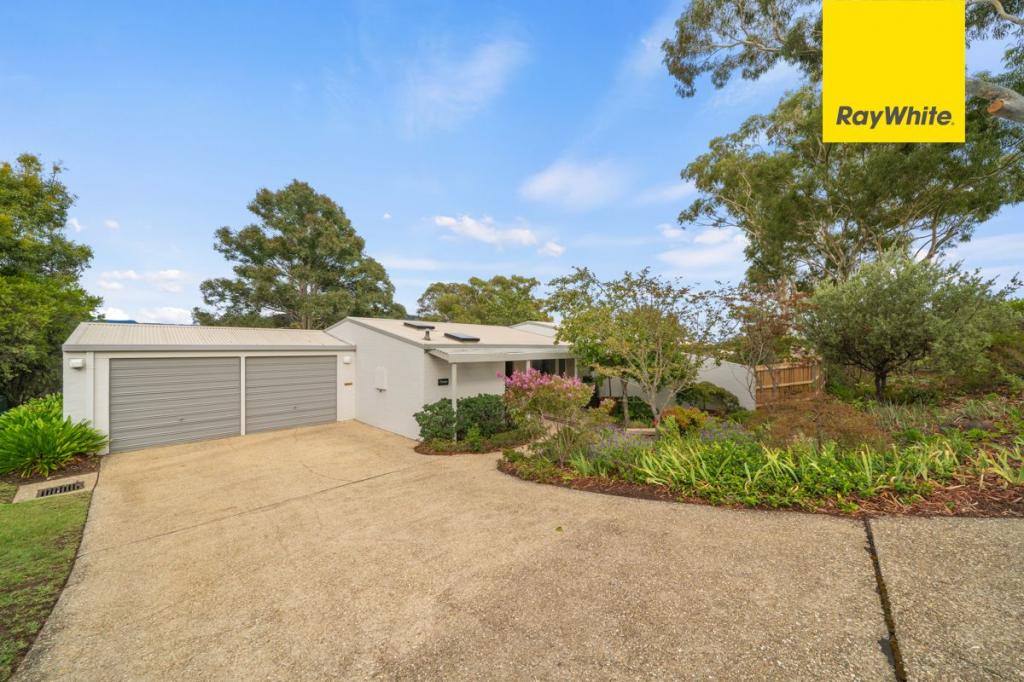
27 Spafford CrescentFarrer ACT 2607
Property Details for 27 Spafford Cres, Farrer
27 Spafford Cres, Farrer is a 4 bedroom, 3 bathroom House with 1 parking spaces and was built in 1969. The property has a land size of 984m2 and floor size of 189m2. While the property is not currently for sale or for rent, it was last sold in May 2018.
Last Listing description (May 2018)
Set on the high side of the street and offering picturesque views towards Mt. Taylor is this well-presented family home. As you walk up the front stairs and step inside the front entrance you immediately appreciate the care and attention that has gone into this home.The large formal lounge and dining area take full advantage of the wonderful views that this home has to offer. The dining room leads into the kitchen and from hear you look immediately onto the rear deck and back yard so you'll be able to watch the kids play knowing that are they are safe and sound in the large secure back yard. The kitchen is generous in its size and features ample cupboard and bench space. It includes a dishwasher and extra-large stainless steel oven and five burner gas cooktop.The covered rear deck is the ideal extension of the living areas and will mean that summers can be spent out in this area with friends and family enjoying each other company and making happy memories of the time spent here.There is a garage underneath with storage that will allow you to put those not so regularly required items out of the way.Features include:Ducted gas heatingReverse cycle air conditioningBamboo flooring to living areasFreshly painted throughoutWalking distance to Farrer Primary & Pre-SchoolClose to Marist College CanberraClose proximity to the Farrer & Mawson ShopsEasy access to roads that lead to Woden, the City, Tuggeranong & FyshwickOutgoings:Rates: $747 p/qtr (approx.)Land Tax: (if rented out) $1185 p/qtr (approx.)UV: $504,000Block Size: 984m2 (approx.)Living Area: 137m2 (approx.)Construction Date: 1969
Property History for 27 Spafford Cres, Farrer, ACT 2607
- 16 May 2018Sold for $780,000
- 19 Apr 2018Listed for Sale Not Disclosed
- 17 Apr 2013Listed for Rent - Price not available

Recent sales nearby
See more recent sales nearbySimilar properties For Sale nearby
See more properties for sale nearby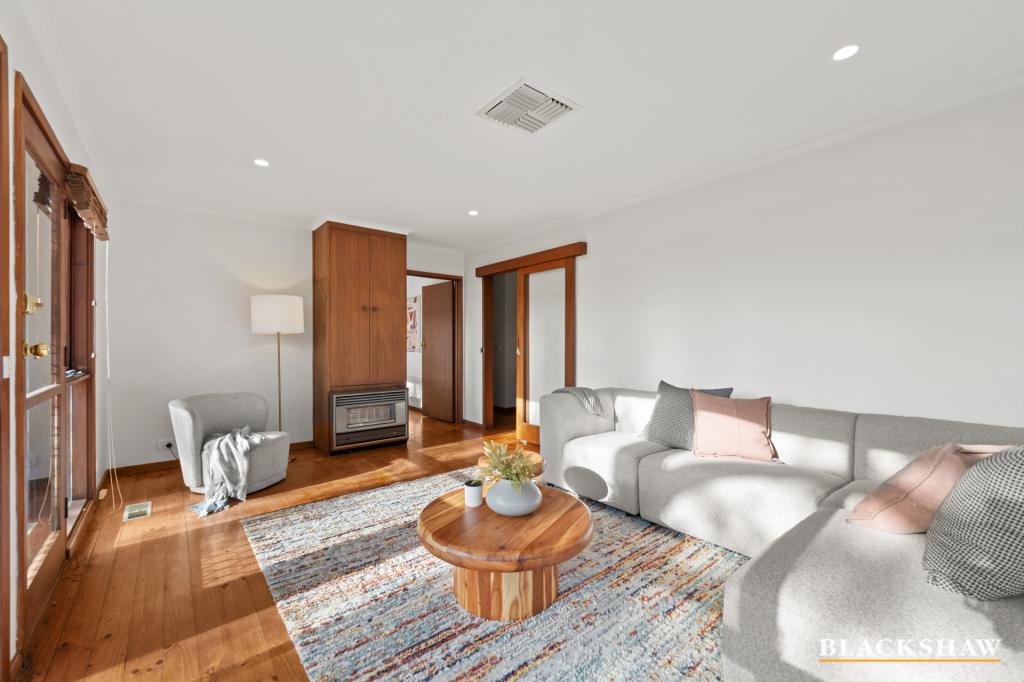 0
0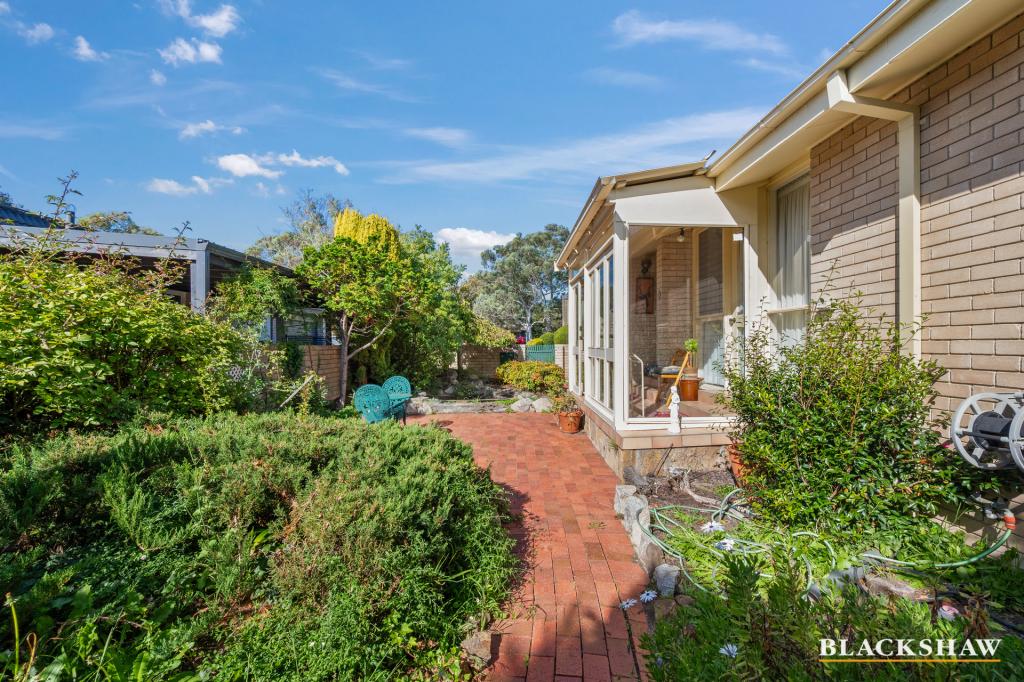 0
0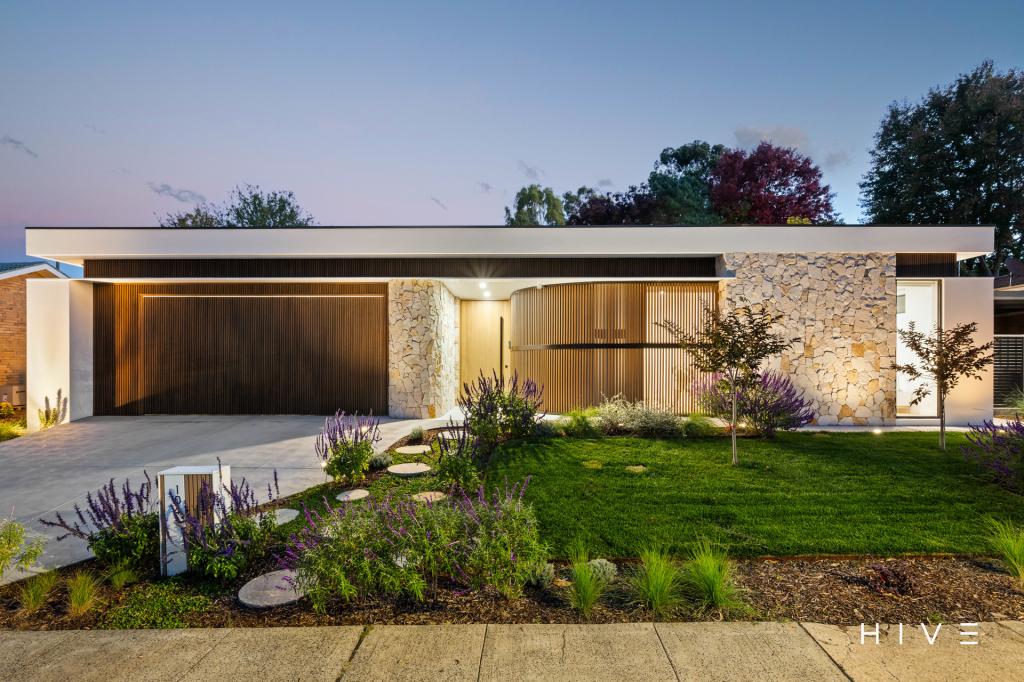 0
0
Similar properties For Rent nearby
See more properties for rent nearby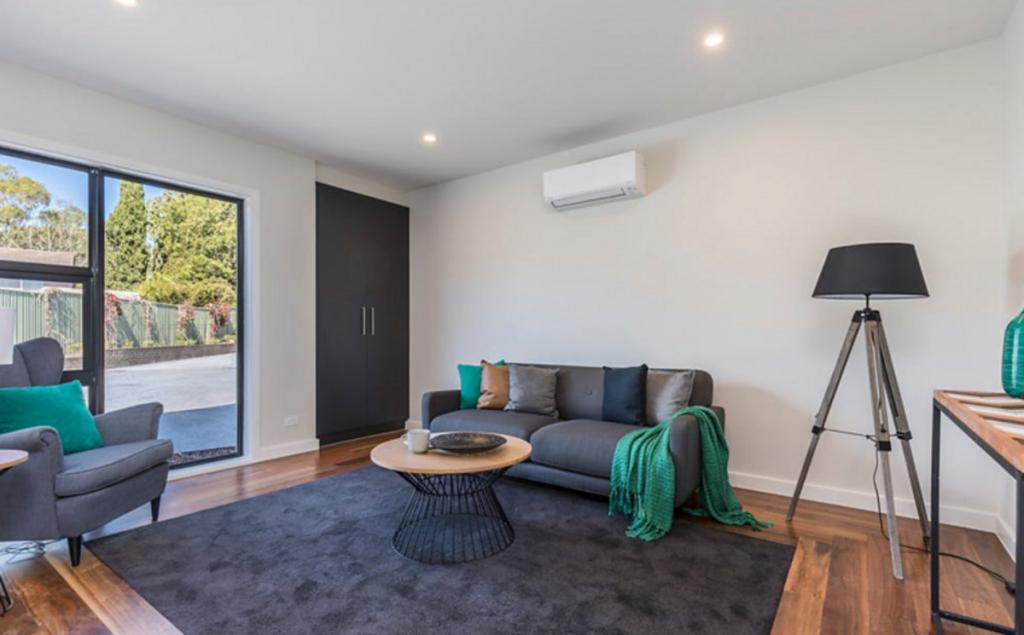 0
0
 0
0 0
0About Farrer 2607
The size of Farrer is approximately 2.1 square kilometres. There are 11 parks, covering nearly 18.6% of the total area. The population of Farrer in 2016 was 3231 people. By 2021 the population was 3787 showing a population growth of 17.2% in the area during that time. The predominant age group in Farrer is 10-19 years. Households in Farrer are primarily couples with children and are likely to be repaying $3000 - $3999 per month on mortgage repayments. In general, people in Farrer work in a professional occupation.In 2021, 73.60% of the homes in Farrer were owner-occupied compared with 76.10% in 2016.
Farrer has 1,617 properties. Over the last 5 years, Houses in Farrer have seen a 8.29% increase in median value, while Units have seen a 20.60% increase. As at 30 June 2026:
- The median value for Houses in Farrer is $1,329,574 while the median value for Units is $572,943.
- Houses have a median rent of $770 while Units have a median rent of $560.
Suburb Insights for Farrer 2607
Market Insights
Farrer Trends for Houses
N/A
N/A
View TrendN/A
N/A
Farrer Trends for Units
N/A
N/A
View TrendN/A
N/A
Neighbourhood Insights
© Copyright 2026. RP Data Pty Ltd trading as Cotality (Cotality). All rights reserved. No reproduction, distribution, or transmission of the copyrighted materials is permitted. The information is deemed reliable but not guaranteed.
While Cotality uses commercially reasonable efforts to ensure the Cotality Data is current, Cotality does not warrant the accuracy, currency or completeness of the Cotality Data and to the full extent permitted by law excludes all loss or damage howsoever arising (including through negligence) in connection with the Cotality Data.
This product uses cookies and other similar technologies to improve and customise your browsing experience, to tailor content and adverts, and for analytics and metrics regarding visitor usage on this product and other media. We may share cookie and analytics information with third parties for the purposes of advertising. By continuing to use our website, you consent to cookies being used. View our Privacy Policy here.
X