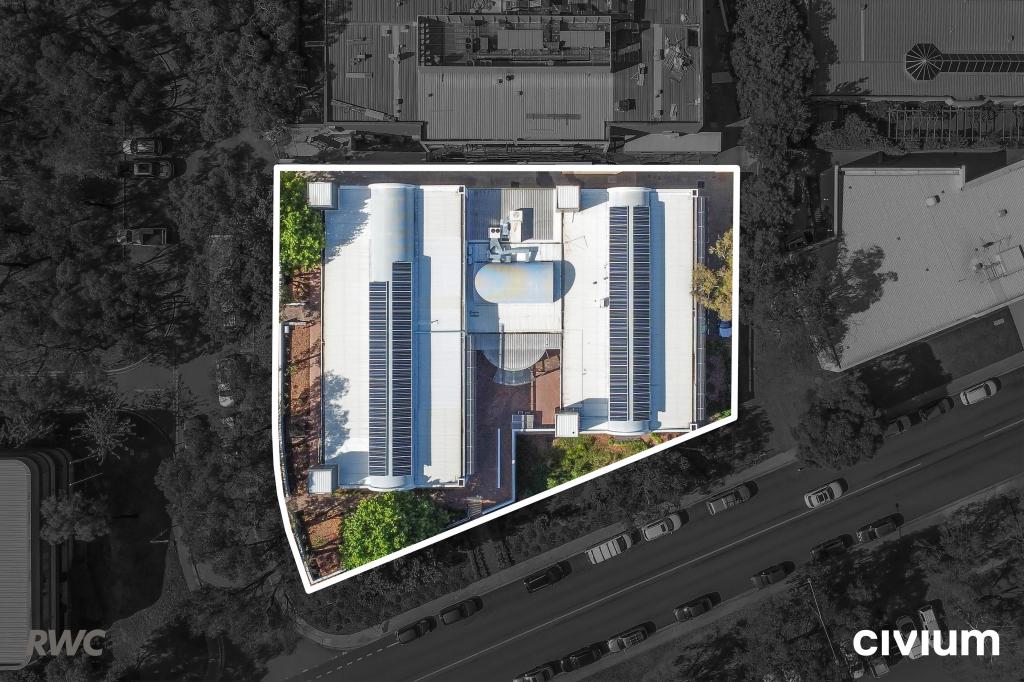
7/17 Napier CloseDeakin ACT 2600
Property Details for 7/17 Napier Cl, Deakin
Last Listing description (October 2020)
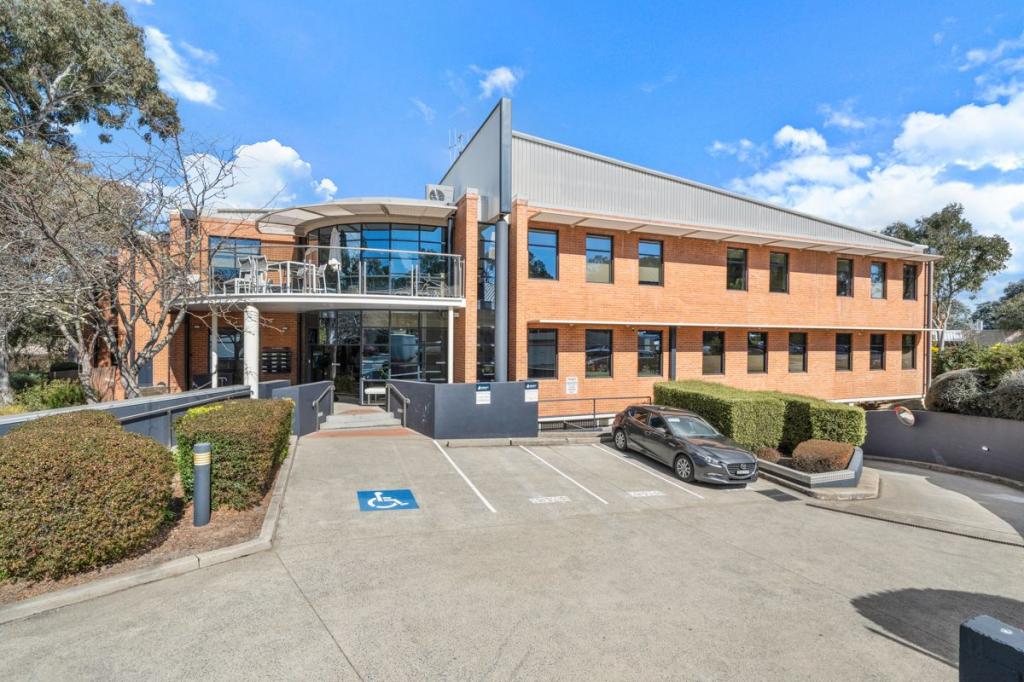
The precinct of Deakin is the address for many national associations and corporate entities. Its proximity to the Parliamentary triangle, CBD and Woden Town Centre allows convenient access to these important business hubs.
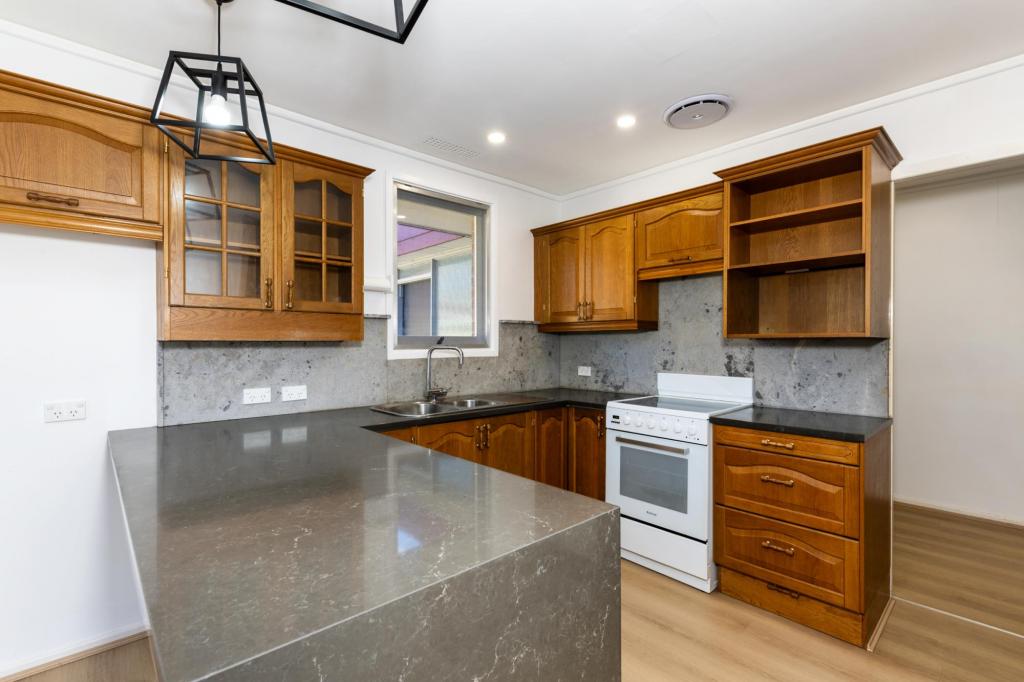
Available for lease is 120* tenancy which benefits from the following:
3 private offices, open plan work area, boardroom and 5 dedicated car spaces included.
For further information or to arrange for an inspection of this property please contact the exclusive leasing agents.
Approx*
Property History for 7/17 Napier Cl, Deakin, ACT 2600
- 10 Sep 2019Listed for Rent - Price not available
- 28 Oct 2016Listed for Rent $42,700 / year
- 12 Jun 2015Listed for Rent - Price not available
Recent sales nearby
See more recent sales nearbySimilar properties For Sale nearby
See more properties for sale nearby


Similar properties For Rent nearby
See more properties for rent nearby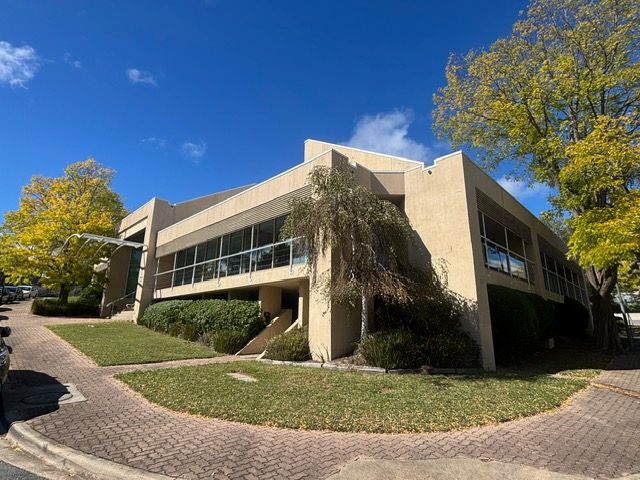

About Deakin 2600
The size of Deakin is approximately 3.6 square kilometres. It has 7 parks covering nearly 29.2% of total area. The population of Deakin in 2016 was 2878 people. By 2021 the population was 3124 showing a population growth of 8.6% in the area during that time. The predominant age group in Deakin is 10-19 years. Households in Deakin are primarily couples with children and are likely to be repaying over $4000 per month on mortgage repayments. In general, people in Deakin work in a professional occupation.In 2021, 73.00% of the homes in Deakin were owner-occupied compared with 70.60% in 2016..
Deakin has 2,008 properties. Over the last 5 years, Houses in Deakin have seen a 49.10% increase in median value, while Units have seen a 56.06% increase. As at 30 June 2025:
- The median value for Houses in Deakin is $2,039,098 while the median value for Units is $1,018,498.
- Houses have a median rent of $950 while Units have a median rent of $595.
What's around 7/17 Napier Cl, Deakin
7/17 Napier Cl, Deakin is in the school catchment zone for Alfred Deakin High School and Yarralumla Primary School.


Suburb Insights for Deakin 2600
Market Insights
Deakin Trends for Houses
$2.04M
7.31%
View Trend$950/W
2.77%
Deakin Trends for Units
$1.02M
6.94%
View Trend$595/W
3.89%
Neighbourhood Insights
Age
Population 3,124
0-9
10%
10-19
14%
20-29
9%
30-39
9%
40-49
14%
50-59
13%
60-69
12%
70-79
11%
80-89
6%
90-99
2%
Household Structure
Occupancy
© Copyright 2025 RP Data Pty Ltd trading as CoreLogic Asia Pacific (CoreLogic). All rights reserved.
This product uses cookies and other similar technologies to improve and customise your browsing experience, to tailor content and adverts, and for analytics and metrics regarding visitor usage on this product and other media. We may share cookie and analytics information with third parties for the purposes of advertising. By continuing to use our website, you consent to cookies being used. View our Privacy Policy here.
X