2 Okra Place, Bellbowrie, QLD 4070 | Property Value & History | OnTheHouse
OFF MARKET
Are you the owner?

2 Okra Place
Bellbowrie QLD 4070

Bedrooms: 4
Bathrooms: 2
Car spaces: 2
Floor area: 173m2
Land area: 848m2
Estimated Value & Rent
Estimated Value
Estimated Rent
Medium Confidence
Last updated 14 Jul 2025
Low

High
$1.00M
$1.10M
Save

Property Details for 2 Okra Pl, Bellbowrie

2 Okra Pl, Bellbowrie is a 4 bedroom, 2 bathroom House with 2 parking spaces. The property has a land size of 848m2 and floor size of 173m2. While the property is not currently for sale or for rent, it was last sold in September 2006.

Building Type
House
Floor Size
173m2
Land Size
848m2
Local Government
Brisbane
Lot/Plan
22/SP170601

Last Listing description (January 2021)

This property is on a large corner block that is fenced all the way around, giving you separate front and back yard. Inside offers 4 bedrooms with air con to all rooms.
Like entertaining? Check out the large undercover entertaining area.

Property Features

- 4 bedrooms
- Each bedroom has ceiling fans and air conditioning
- Sunken Lounge with vaulted ceilings & air conditioning
- Large kitchen and dining
- Undercover patio to the front
- Fenced all away around
- Double Garage
- Undercover entertainment area out the back
- Pets Negotiable
- Walking distance to the local shops & public transport

Property History for 2 Okra Pl, Bellbowrie, QLD 4070

A timeline of how this property has performed in the market
Last Sold
$335,000
07 Sep 2006
Listed for Rent
$435/w
04 Jan 2021
  • 13 Oct 2020
    Listed for Rent $435 / week
  • 30 Oct 2018
    Listed for Rent - Price not available
  • 07 Mar 2018
    Listed for Rent - Price not available
Sign in to see more transactions

Commute Calculator

Where to?
-
-
-
-

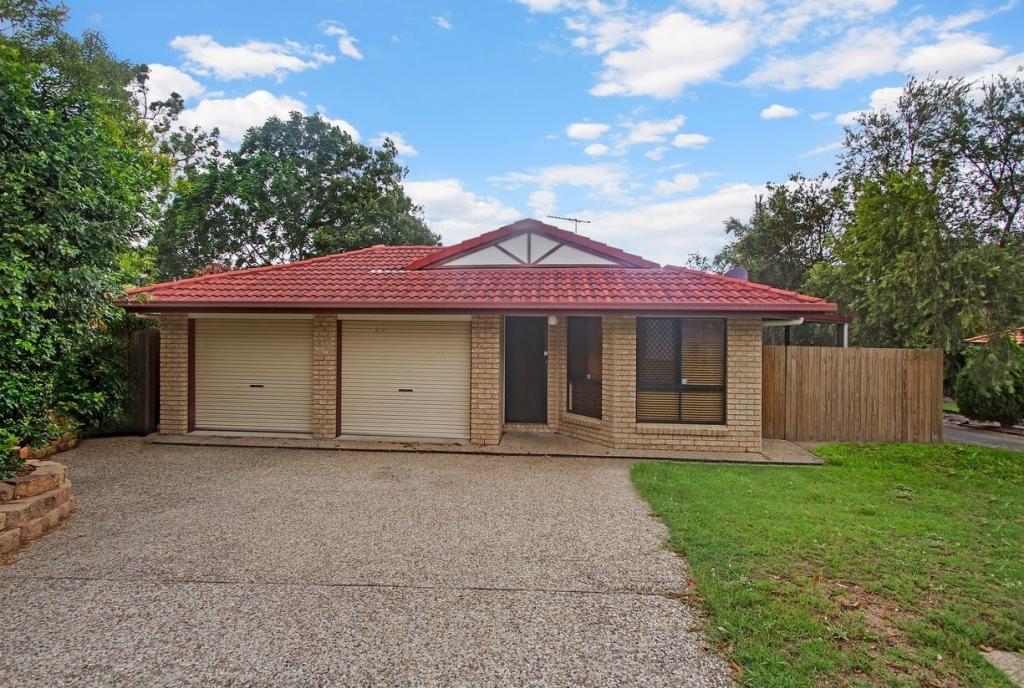
About Bellbowrie 4070

The size of Bellbowrie is approximately 5.7 square kilometres. It has 21 parks covering nearly 7.6% of total area. The population of Bellbowrie in 2016 was 5462 people. By 2021 the population was 5495 showing a population growth of 0.6% in the area during that time. The predominant age group in Bellbowrie is 10-19 years. Households in Bellbowrie are primarily couples with children and are likely to be repaying $1800 - $2399 per month on mortgage repayments. In general, people in Bellbowrie work in a professional occupation.In 2021, 85.40% of the homes in Bellbowrie were owner-occupied compared with 83.00% in 2016..

Bellbowrie has 2,032 properties. Over the last 5 years, Houses in Bellbowrie have seen a 100.71% increase in median value, while Units have seen a 87.97% increase. As at 30 June 2025:

  • The median value for Houses in Bellbowrie is $1,087,435 while the median value for Units is $822,089.
  • Houses have a median rent of $700.
There are currently 23 properties listed for sale, and 3 properties listed for rent in Bellbowrie on OnTheHouse. According to CoreLogic's data, 60 properties were sold in the past 12 months in Bellbowrie.

What's around 2 Okra Pl, Bellbowrie

2 Okra Pl, Bellbowrie is in the school catchment zone for Moggill State School.

Nearby Schools
Comparable Properties
Moggill State School
0.75km
Moggill 4070
IN CATCHMENTPrimaryGovernmentP - 6Combined736 Enrolled
Pullenvale State School
3.53km
Pullenvale 4069
PrimaryGovernmentP - 6Combined434 Enrolled
Middle Park State School
3.74km
Middle Park 4074
PrimaryGovernmentP - 6Combined646 Enrolled
Redbank State School
4.74km
Redbank 4301
PrimaryGovernmentP - 6Combined215 Enrolled
Brisbane Youth Education and Training Centre
4.78km
Wacol 4076
CombinedGovernment6 - 12Combined123 Enrolled
Good News Lutheran School
4.78km
Middle Park 4074
PrimaryNon-GovernmentP - 6Combined352 Enrolled
Jamboree Heights State School
4.97km
Jamboree Heights 4074
PrimaryGovernmentP - 6Combined819 Enrolled
Goodna State School
5.02km
Goodna 4300
PrimaryGovernmentP - 6Combined768 Enrolled
YOS Lawnton - Goodna Campus
5.37km
Goodna 4300
SecondaryNon-GovernmentCombined Enrolled
Karalee State School
5.37km
Karalee 4306
PrimaryGovernmentP - 6Combined566 Enrolled

Suburb Insights for Bellbowrie 4070

Market Insights
Bellbowrie Trends for Houses
Median Value

$1.09M

4.58%
View Trend
Median Growth

7.23%

View Trend
Median Rent

$700/W

2.56%
View Trend
Rental Yield

3.61%

9.07%
View Trend
Median Value: The middle value of all properties across the geography based on the Automated Valuation Model.


Median Value over 1 year (07/24 - 06/25)
Bellbowrie Trends for Units
Median Value

$822k

0.05%
View Trend
Median Growth

2.82%

View Trend
Median Rent

N/A

-
View Trend
Rental Yield

N/A

-
View Trend
Median Value: The middle value of all properties across the geography based on the Automated Valuation Model.


Median Value over 1 year (07/24 - 06/25)
Neighbourhood Insights
Age

Population 5,495

0-9


12%

10-19


16%

20-29


9%

30-39


10%

40-49


15%

50-59


16%

60-69


11%

70-79


8%

80-89


3%

Household Structure
Occupancy
CoreLogic Copyright and Legal Disclaimers about Property Data
Disclaimer
Whilst all reasonable effort is made to ensure the information in this publication is current, CoreLogic does not warrant the accuracy or completeness of the data and information contained in this publication and to the full extent not prohibited by law excludes all liability for any loss or damage arising in connection with the data and information contained in this publication.
Queensland data
Based on or contains data provided by the State of Queensland (Department of Resources) 2025. In consideration of the State permitting use of this data you acknowledge and agree that the State gives no warranty in relation to the data (including accuracy, reliability, completeness, currency or suitability) and accepts no liability (including without limitation, liability in negligence) for any loss, damage or costs (including consequential damage) relating to any use of the data. Data must not be used for direct marketing or be used in breach of the privacy laws; more information at www.propertydatacodeofconduct.com.au
Valuations and Estimates
This estimate is provided by CoreLogic, and is based on statistical market data such as recent local sales, property size, number of bedrooms and many more factors. It comes from public data, which may be incomplete or inaccurate, and should not be used in lieu of a professional appraisal under any circumstances, including for lending purposes or in home loan applications.
School data and Content
Product Data licenced by CoreLogic under a Creative Commons Attribution licence. For details regarding licence, data source, copyright and disclaimers, see https://www.corelogic.com.au/legals/third-party-restrictions
ABS data
This publication contains data and statistics provided by the Australian Bureau of Statistics, available at http://www.abs.gov.au/ and reproduced under Creative Commons Attribution 2.5 http://creativecommons.org/licenses/by/2.5/au/legalcode
Liveability information
The Liveability Score is a rating (out of 10) provided by Propella.ai Pty Ltd as a guide about how "well-connected" properties are in certain local areas. The Liveability Score is based on statistical data about a local area in which a property is located including the distance to and number of available facilities and services (including schools, parklands, health services, shopping and public transport) (Liveability Data). The Liveability Data and Liveability Score has not been verified or confirmed by CoreLogic, is not available for all properties, and is of a general nature and should not be construed as specific advice or relied upon in lieu of appropriate professional advice. Given the relative nature of the Liveability Score, propella.ai anticipate that scores for individual properties will change over time.