11 Mark StreetMerrylands NSW 2160

Thinking about insurance?
Get estimated rebuild costs for this property with Sum SureProperty Details for 11 Mark St, Merrylands
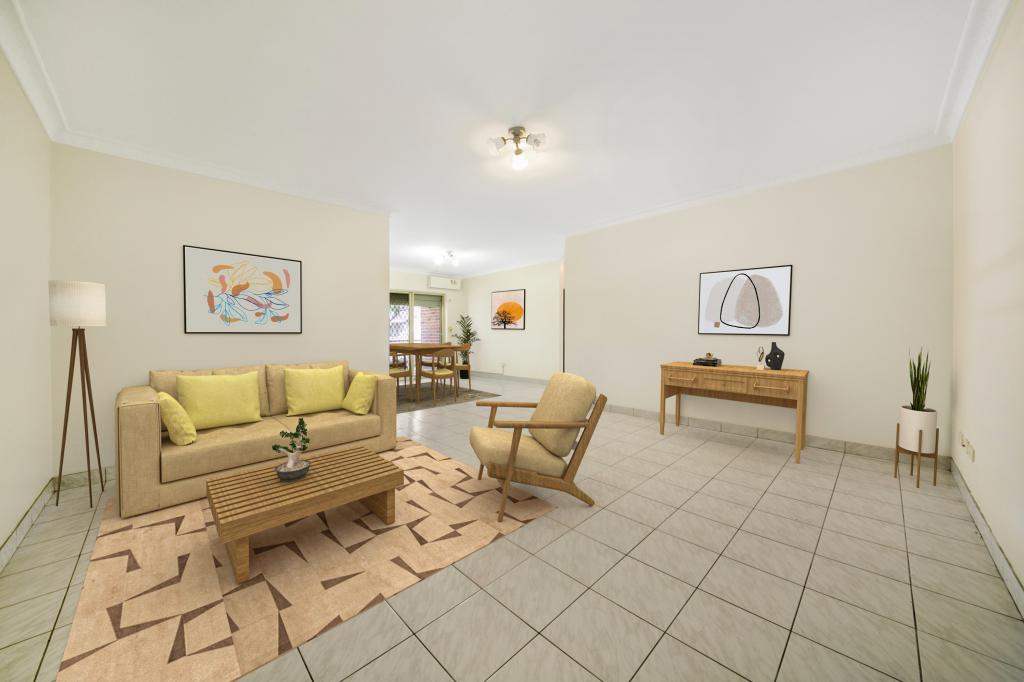
11 Mark St, Merrylands is a 2 bedroom, 1 bathroom House with 1 parking spaces and was built in 1960. The property has a land size of 594m2 and floor size of 78m2. While the property is not currently for sale or for rent, it was last sold in February 2020.
Last Listing description (May 2025)
Superb two bedroom home that features a modern kitchen and bathroom and a glorious backyard for the kids!
Features Include:-
+ Two spacious bedrooms with built-ins to both bedrooms
+ Split Air-conditioning to lounge room
+ Modern kitchen with gas cooktop
+ Renovated bathroom
+ Polished floors through-out
+ Internal laundry
+ Huge backyard for the kids
+ Single Carport
+ Located close to T-Way bus Service to Parramatta, Schools and IGA Supermarket
+ Inspections welcome via the details below
Located Approximately: -
270m to IGA Supermarket
1.3km to Cerdon College High School
1.5km to Merrylands High School
RENTING WITH STARR PARTNERS IS EASY!
We have high quality 3D Virtual Tours, photos, and floor plans to enable you to inspect & lease properties online.
Want to lease this property? View the Virtual Tour, photos, and floor plan.
Submit your application.
We will seek pre-approval of your application.
If pre-approved, we can arrange a private inspection of the property for you and arrange for you to DocuSign your lease agreement.
"Advertising disclaimer: The information provided herewith has been furnished to us. We have not verified whether or not that information is accurate and do not have any belief one way or the other in its accuracy. We do not accept any responsibility to any person for its accuracy and do no more than pass it on. All interested parties should make and rely on their own inquiries in order to determine whether or not this information is in fact accurate"
Property History for 11 Mark St, Merrylands, NSW 2160
- 26 Mar 2025Listed for Rent $580 / week
- 20 Feb 2024Listed for Rent $570 / week
- 30 Mar 2020Listed for Rent $450 / week
Recent sales nearby
See more recent sales nearbySimilar properties For Sale nearby
See more properties for sale nearby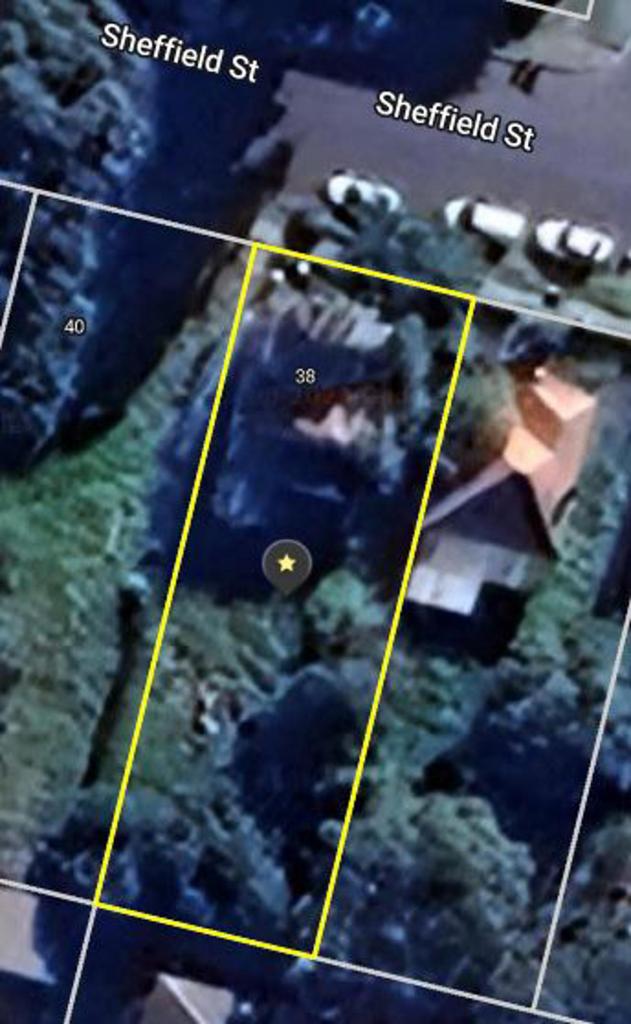

Similar properties For Rent nearby
See more properties for rent nearby
About Merrylands 2160
The size of Merrylands is approximately 6.7 square kilometres. It has 44 parks covering nearly 8% of total area. The population of Merrylands in 2011 was 26,658 people. By 2016 the population was 29,647 showing a population growth of 11.2% in the area during that time. The predominant age group in Merrylands is 20-29 years. Households in Merrylands are primarily couples with children and are likely to be repaying $1800 - $2399 per month on mortgage repayments. In general, people in Merrylands work in a professional occupation. In 2011, 56.7% of the homes in Merrylands were owner-occupied compared with 51.6% in 2016.
Merrylands has 14,967 properties. Over the last 5 years, Houses in Merrylands have seen a 44.74% increase in median value, while Units have seen a 6.93% increase. As at 30 April 2025:
- The median value for Houses in Merrylands is $1,301,021 while the median value for Units is $512,856.
- Houses have a median rent of $700 while Units have a median rent of $580.
What's around 11 Mark St, Merrylands
11 Mark St, Merrylands is in the school catchment zone for Ringrose Public School.


Suburb Insights for Merrylands 2160
Market Insights
Merrylands Trends for Houses
$1.30M
6.01%
View Trend$700/W
3.09%
Merrylands Trends for Units
$513k
0.68%
View Trend$580/W
5.83%
Neighbourhood Insights
Age
Population 29,647
0-9
15%
10-19
12%
20-29
18%
30-39
17%
40-49
12%
50-59
11%
60-69
8%
70-79
4%
80-89
3%
Household Structure
Occupancy
© Copyright 2025 RP Data Pty Ltd trading as CoreLogic Asia Pacific (CoreLogic). All rights reserved.
This product uses cookies and other similar technologies to improve and customise your browsing experience, to tailor content and adverts, and for analytics and metrics regarding visitor usage on this product and other media. We may share cookie and analytics information with third parties for the purposes of advertising. By continuing to use our website, you consent to cookies being used. View our Privacy Policy here.
X