22 Cromer RoadCromer NSW 2099

Thinking about insurance?
Get estimated rebuild costs for this property with Sum SureProperty Details for 22 Cromer Rd, Cromer
22 Cromer Rd, Cromer is a 5 bedroom, 4 bathroom House with 2 parking spaces and was built in 2000. The property has a land size of 831m2 and floor size of 477m2. While the property is not currently for sale or for rent, it was last sold in September 2001.
Last Listing description (April 2017)
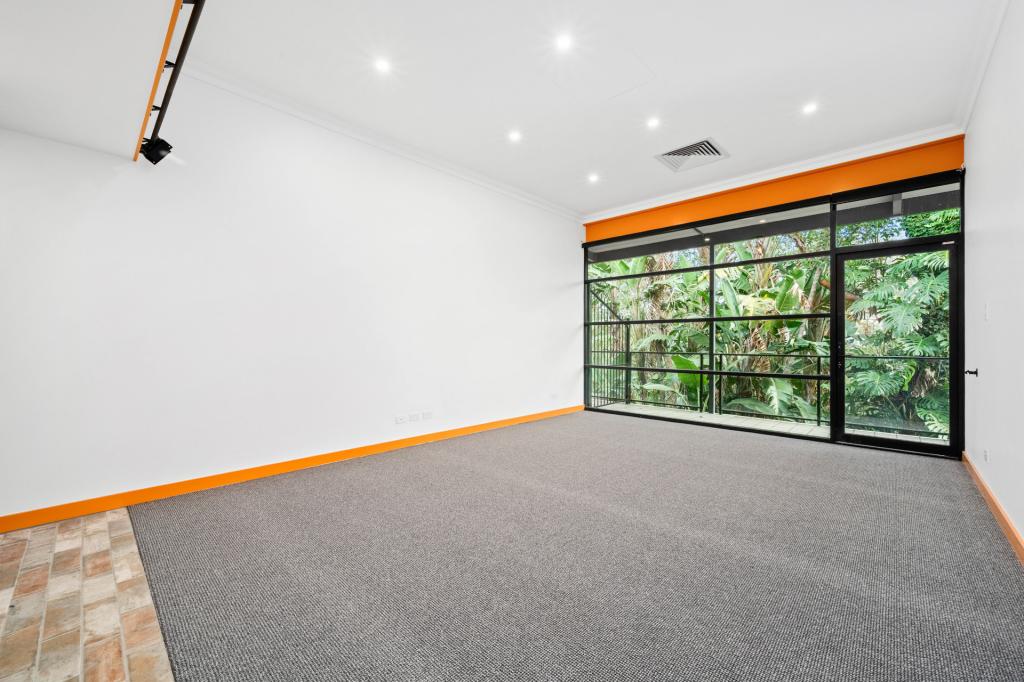
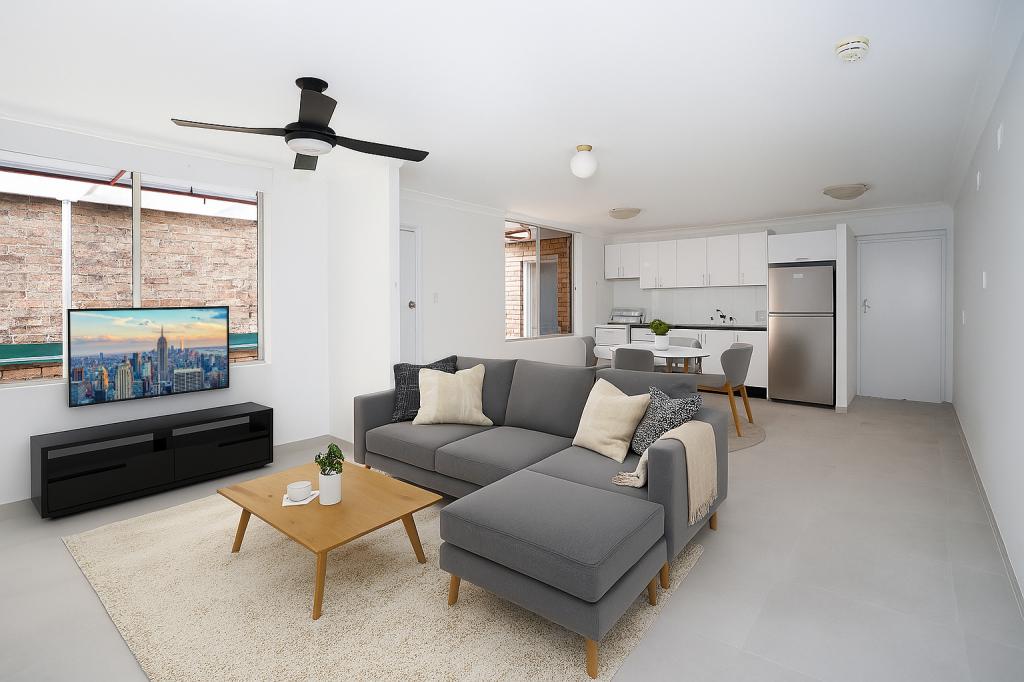
This is a spacious modern 2 bed garden flat in a quiet street. Features include;
- 2 double bedrooms one with mirror robe
- Open plan kitchen living area
- Internal laundry
- Outdoor area with clothes line
- Modern bathroom with bath and shower
- Includes Foxtel and water
- On street parking in nice quiet street
Great family garden flat, apply now!
Property History for 22 Cromer Rd, Cromer, NSW 2099
- 22 Feb 2017Listed for Rent - Price not available
- 10 Sep 2001Sold for $390,000
Recent sales nearby
See more recent sales nearby
Similar properties For Sale nearby
See more properties for sale nearby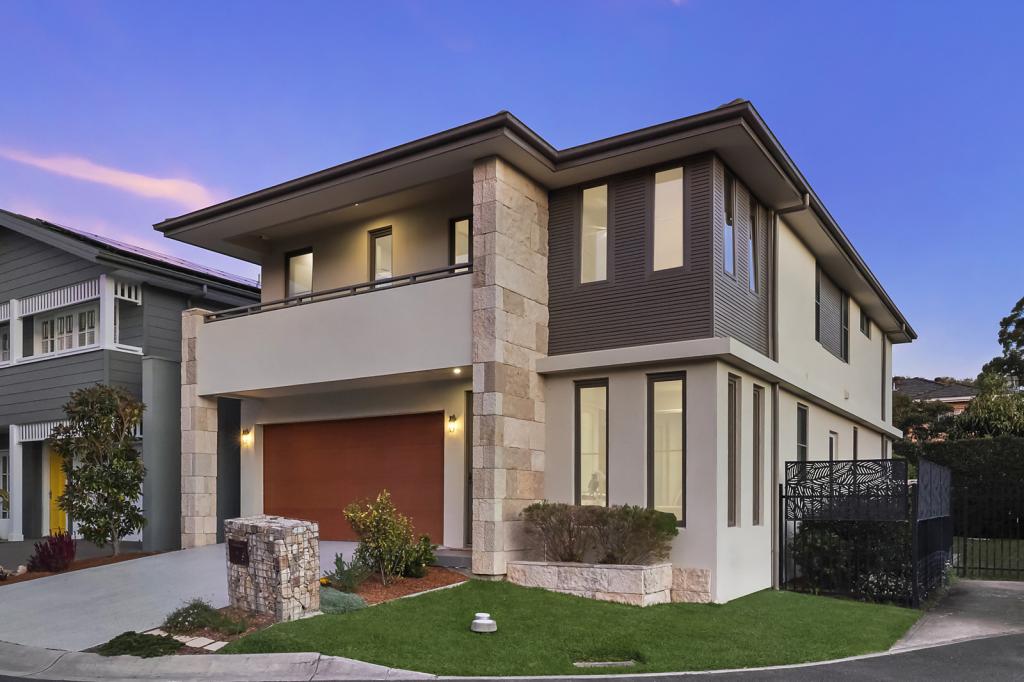


Similar properties For Rent nearby
See more properties for rent nearby
About Cromer 2099
The size of Cromer is approximately 6.3 square kilometres. It has 30 parks covering nearly 15.5% of total area. The population of Cromer in 2016 was 7592 people. By 2021 the population was 8030 showing a population growth of 5.8% in the area during that time. The predominant age group in Cromer is 40-49 years. Households in Cromer are primarily couples with children and are likely to be repaying over $4000 per month on mortgage repayments. In general, people in Cromer work in a professional occupation.In 2021, 77.90% of the homes in Cromer were owner-occupied compared with 79.00% in 2016..
Cromer has 3,570 properties. Over the last 5 years, Houses in Cromer have seen a 53.34% increase in median value, while Units have seen a 27.51% increase. As at 31 May 2025:
- The median value for Houses in Cromer is $2,292,094 while the median value for Units is $1,099,648.
- Houses have a median rent of $1,200 while Units have a median rent of $650.
What's around 22 Cromer Rd, Cromer
22 Cromer Rd, Cromer is in the school catchment zone for Cromer Public School and Northern Beaches Secondary College Cromer Campus.


Suburb Insights for Cromer 2099
Market Insights
Cromer Trends for Houses
$2.29M
2.72%
View Trend$1.20k/W
2.95%
Cromer Trends for Units
$1.10M
-6.11%
View Trend$650/W
3.49%
Neighbourhood Insights
Age
Population 8,030
0-9
13%
10-19
15%
20-29
9%
30-39
10%
40-49
16%
50-59
14%
60-69
9%
70-79
9%
80-89
4%
90-99
1%
Household Structure
Occupancy
© Copyright 2025 RP Data Pty Ltd trading as CoreLogic Asia Pacific (CoreLogic). All rights reserved.
This product uses cookies and other similar technologies to improve and customise your browsing experience, to tailor content and adverts, and for analytics and metrics regarding visitor usage on this product and other media. We may share cookie and analytics information with third parties for the purposes of advertising. By continuing to use our website, you consent to cookies being used. View our Privacy Policy here.
X